A client once messaged me at 11 PM asking why their Facebook ad “wasn’t working” because the CTR read 0.9%. Two accounts over, a different client was celebrating a 0.9% CTR because it had cut their cost per lead in half. Same number, opposite reactions. That’s the thing about click-through rate on Meta – it only means something once you know the industry, the objective, and the placement it came from.
This guide breaks down what a good CTR actually looks like on Facebook and Instagram right now, why the “good” number shifts depending on what you’re running, and what to check before you assume your ads are underperforming.
Quick Answer
Recent third-party Facebook Ads benchmarks put many traffic-campaign CTRs in the low-single-digit range, but there is no universal 2026 platform average that applies to every objective, placement, geography, and reporting setup. Treat the figures below as comparison context from a 2025 LocaliQ/WordStream dataset, not as a pass/fail rule for your account.
If your CTR is materially below the closest industry and objective benchmark, review creative, audience fit, placement mix, and cost per result together before changing budget.
Why CTR Isn’t a Standalone Verdict
CTR tells you whether your ad stopped the scroll. It doesn’t tell you whether the person who clicked was worth acquiring. A jewelry ad with a 3% CTR that converts at 0.4% can lose money next to a B2B software ad with a 0.6% CTR that converts at 9%. Meta’s auction rewards engagement, so a strong CTR can lower your CPM over time – but it’s a leading indicator, not the scoreboard.
Treat it the way you’d treat a pulse check during a workout: useful, informative, and completely meaningless without context on what you’re actually training for.
Average Facebook Ads CTR by Industry (Recent Benchmarks)
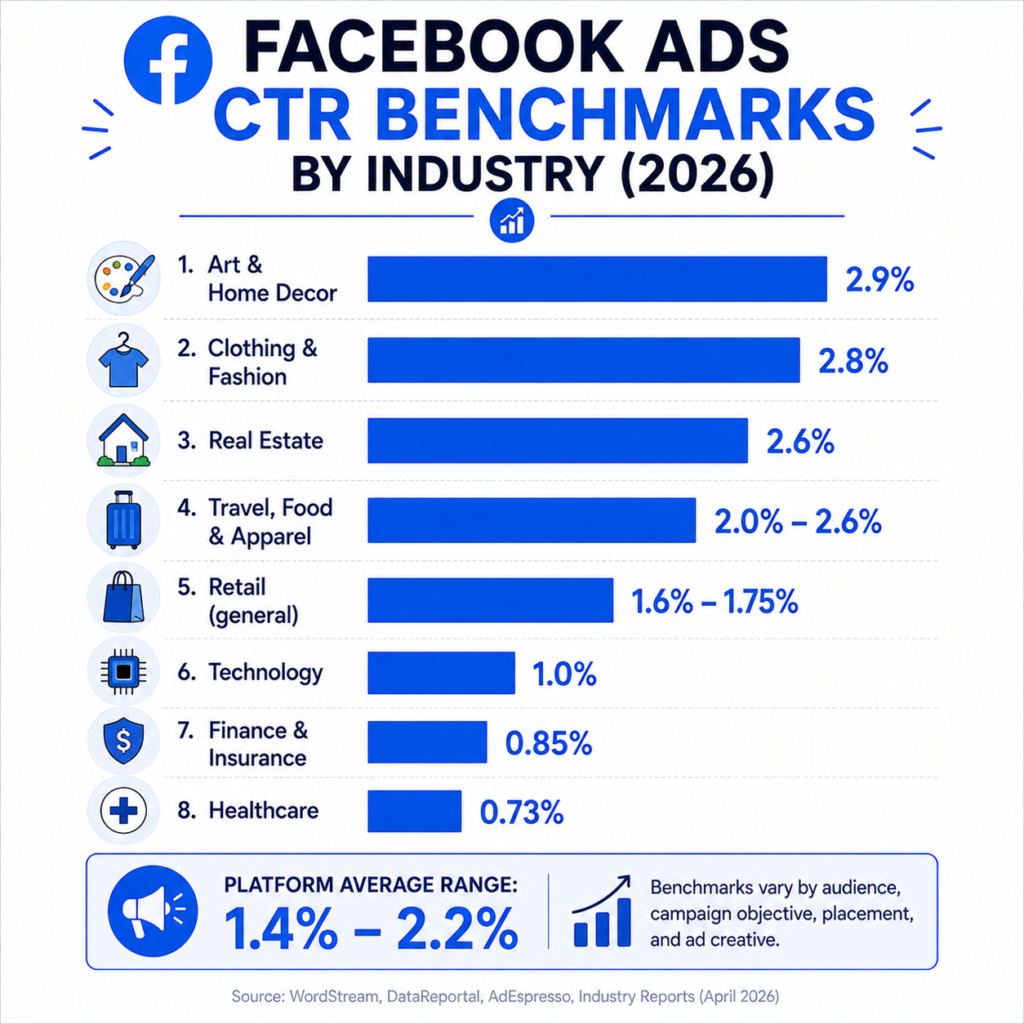
Benchmark reports vary in methodology, but the pattern across sources is consistent – visual, emotionally driven categories cluster at the top, and considered-purchase or B2B categories cluster at the bottom.
| Industry | Approximate Average CTR |
| Art & Home Decor | ~2.9% |
| Clothing & Fashion | ~2.8% |
| Real Estate | ~2.6% |
| Travel, Food & Apparel | 2.0%-2.6% |
| Retail (general) | 1.6%-1.75% |
| Technology | ~1.0% |
| Finance & Insurance | ~0.85% |
| Healthcare | ~0.73% |
Lower-CTR categories in the dataset are a useful reminder that a small percentage does not automatically mean a broken campaign. In regulated or high-consideration categories, the better question is whether clicks are turning into qualified leads at an acceptable cost.
If you want to check where your own number lands against a specific vertical, run it through the CTR calculator first, then compare against the table above rather than a flat “good CTR” rule of thumb.
CTR by Campaign Objective
Objective changes the baseline as much as industry does, because Meta optimizes delivery differently depending on what you told it to optimize for.
- Traffic campaigns: commonly average around 1.5%-1.7%
- Lead generation campaigns: commonly average around 2.5%-2.6%, since the in-platform lead form removes a step
- Conversion/sales campaigns: typically land lower, often in the 1.2%-2.1% range, because the audience is filtered for purchase intent rather than pure engagement
In LocaliQ/WordStream’s 2025 Facebook Ads benchmark data, traffic campaigns averaged 1.71% CTR while lead campaigns averaged 2.59%. If you’re running a lead generation campaign and comparing it against a traffic-campaign benchmark, you can draw the wrong conclusion because Meta is optimizing toward a different action.
Placement Matters More Than Most Advertisers Assume
The same ad set can show very different CTRs across placements. If your account-level CTR looks average, break it out by placement before concluding the creative is the problem; one placement can drag down the blended number while others remain commercially useful.
Device mix can tell a similar story. Compare mobile and desktop results separately before treating a blended CTR as a creative verdict.
How CTR Is Calculated
The formula is simple, but it’s worth stating plainly because “good CTR” questions often come from people mixing up impressions, reach, and clicks.
CTR = (Clicks ÷ Impressions) × 100
Example: an ad gets 480 clicks from 32,000 impressions. 480 ÷ 32,000 = 0.015 → 1.5% CTR
Facebook also reports “CTR (link click-through rate)” separately from “CTR (all),” which includes reactions, comments, and shares as clicks. If you’re benchmarking against industry data, confirm which version you’re using – link CTR is almost always the lower, more conservative number, and it’s the one that maps most directly to actual traffic. You can run this calculation instantly with the CTR calculator instead of doing the math by hand each time you check performance.
Realistic Business Scenarios
Ecommerce apparel brand: Running Advantage+ Shopping with a $50/day budget, seeing a 2.6% CTR and a 1.8% conversion rate. That CTR sits above the apparel benchmark, which lines up with the visual, impulse-driven nature of the category. The next lever here isn’t the ad – it’s checking whether the landing page and checkout are converting that traffic efficiently, which is a job for the AOV calculator and ROAS calculator together.
Local HVAC contractor: Running a lead gen campaign in a mid-size metro, seeing a 0.9% CTR. That looks weak against the 2.5% lead gen average, but home services ads often underperform on CTR while still producing solid cost per lead, because the audience is narrower and less emotionally reactive than fashion or beauty. Before panicking, check cost per lead against the CPA calculator rather than judging the campaign on CTR alone.
B2B SaaS company: Running a traffic campaign to a gated whitepaper, CTR sitting at 0.7%. Against the 1.71% traffic benchmark from the 2025 dataset, that may warrant review, but B2B creative often has a narrower audience and a longer decision path than consumer categories. Testing a more direct, benefit-led headline is a reasonable first experiment.
Marketing agency managing 12 client accounts: Instead of chasing one universal “good CTR” number across every client, the agency benchmarks each account against its own historical baseline and its closest industry range, then flags meaningful drops from that account’s rolling average for creative review. This avoids the common mistake of holding a finance client to a fashion client’s standard.
Common Mistakes When Judging CTR
- Comparing across objectives. A conversion campaign will almost never match a traffic campaign’s CTR, and that’s expected, not a failure.
- Ignoring placement breakdowns. A blended CTR can hide strong Stories performance dragged down by a weak Feed placement, or the reverse.
- Treating CTR as the finish line. A high CTR with a poor landing page experience just means you’re paying for clicks that bounce – worth checking with the bounce rate calculator if you’re sending traffic to a site page rather than a lead form.
- Judging Day 1 or Day 2 performance. Meta’s delivery system needs time and data to optimize; CTR in the first 48 hours is often not representative of where the ad settles.
- Using “CTR (all)” when the benchmark data reflects link CTR, which inflates your number relative to what you’re comparing it against.
When a Below-Average CTR Is Actually Fine
Not every low CTR needs fixing. If your cost per result is on target and your ROAS or CAC is healthy, a below-benchmark CTR in a naturally low-CTR category (finance, healthcare, enterprise software) usually isn’t worth chasing. Optimizing purely for CTR in these categories can backfire – more sensational creative might lift clicks while attracting a lower-intent audience that converts worse. Worth checking the full funnel with the ROI calculator before deciding CTR is the metric to fix.
How to Improve CTR Without Guessing
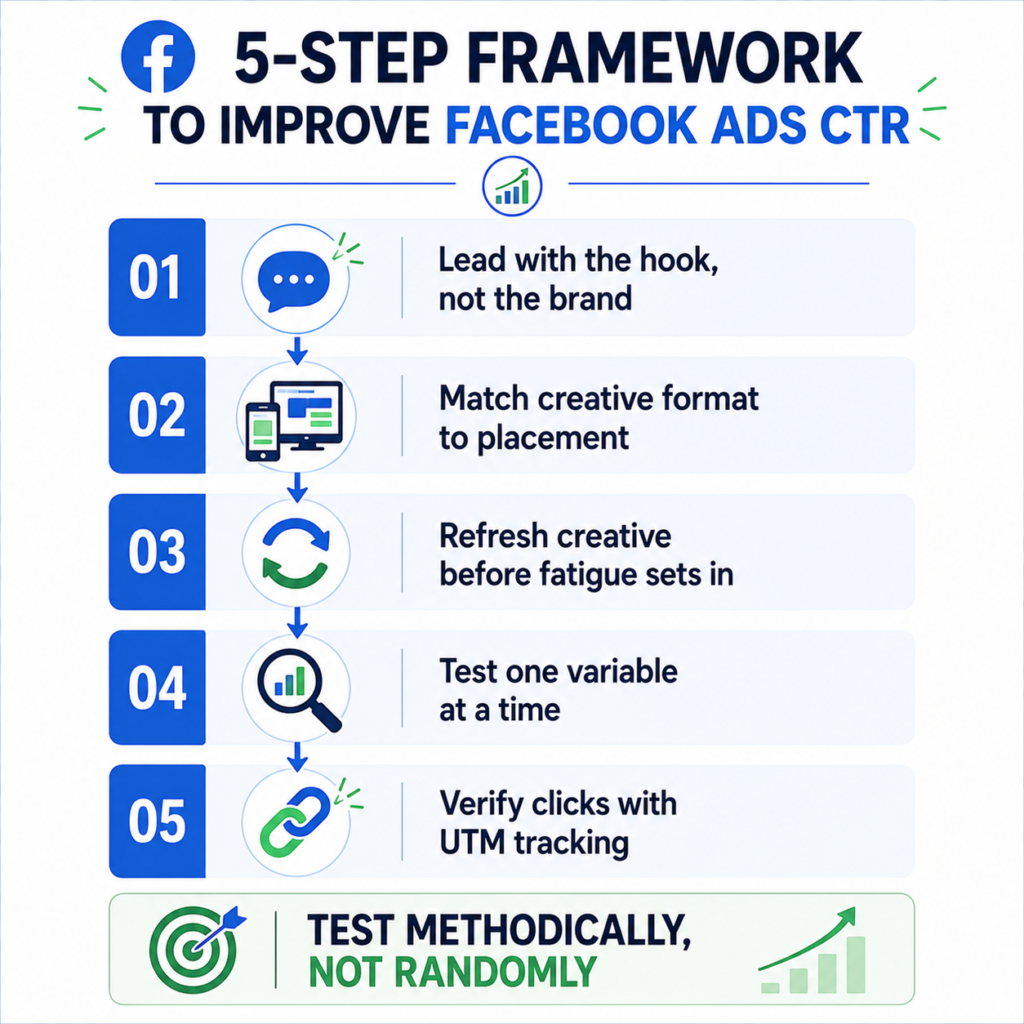
- Lead with the hook, not the brand. The first line of copy and the first frame of video carry most of the weight – test 3-4 distinct hooks before touching anything else.
- Match creative format to placement. Vertical video for Stories and Reels, square or landscape for Feed; a single creative crammed into every placement usually underperforms its potential in at least one of them.
- Refresh creative before fatigue sets in. CTR decline over a 2-3 week window in an unchanged ad set is often fatigue, not a targeting problem.
- Test one variable at a time. Swapping headline, image, and audience simultaneously makes it impossible to know what moved the number.
- Use UTM parameters to confirm the clicks you’re counting actually match the sessions landing on your site – discrepancies here point to tracking issues rather than ad performance. The UTM builder keeps this consistent across campaigns.
Facebook CTR vs. Google Ads CTR
These platforms aren’t directly comparable, and advertisers who run both often get confused when the numbers don’t line up. Google Search, Google Display, Facebook Feed, Instagram Stories, and lead forms all measure different moments of intent. Judge each on its own benchmark set; if you’re curious how Google Ads CTR benchmarks compare, see our breakdown of good CTR for Google Ads.
This article uses general industry data for reference. Actual performance varies by account, audience, and creative. For related tools, see the marketing calculators and blog. Questions about this data? Get in touch.
Frequently Asked Questions
Is a 1% CTR good for Facebook Ads?
For B2B, finance, healthcare, or enterprise categories, yes – 1% often sits close to or above the industry norm. For fashion, home decor, or ecommerce, 1% is below average and worth reviewing creative and audience targeting.
Does CTR affect Facebook ad costs?
Yes, indirectly. Meta’s ad auction factors in estimated action rates alongside bid and ad quality, so a higher CTR can lower your CPM over time. It’s not a direct 1:1 relationship, but sustained low engagement typically pushes delivery costs up.
What’s a good CTR for Facebook Stories vs. Feed?
Stories placements typically run higher than Feed – it’s normal for Stories CTR to sit meaningfully above your Feed CTR within the same ad set, so compare each placement to its own benchmark rather than a blended average.
Should I pause an ad with a low CTR?
Not automatically. Check cost per result and conversion rate first. A low-CTR ad that’s still hitting target CPA or ROAS is doing its job; pausing it because of CTR alone can remove a profitable ad from rotation.
How often should I check CTR benchmarks?
Use external benchmarks as periodic context, not as a weekly optimization trigger. Your own rolling account baseline is usually more actionable than a new external average unless Meta changes reporting, objectives, placements, or auction behavior in a way that affects your campaigns.
Sources and methodology
Facebook Ads CTR benchmarks depend strongly on campaign objective, placement, creative format, audience, attribution window, and reporting setup. The external benchmark source linked below is a LocaliQ Facebook Ads benchmark report; where the source year differs from the article publication year, treat the figures as recent comparison context rather than a guaranteed 2026 average.