Most advertisers ask this question after staring at their Google Ads dashboard for ten minutes, wondering whether the number in front of them is something to celebrate or something to fix. It’s a fair question, and it doesn’t have a single clean answer. A 2% CTR on a Display campaign might be excellent. The same 2% on a branded Search campaign would be a warning sign. Context decides everything here.
This article walks through what actually counts as a good click-through rate in 2026, how benchmarks differ by industry and campaign type, and what to check before you assume your number is a problem.
Quick Answer
Across Search campaigns, the 2026 cross-industry average CTR sits around 6.6%, based on WordStream’s latest benchmark study of over 13,000 US campaigns. Display campaigns average closer to 0.5%. But “average” doesn’t mean “target.” A legal services account running at 4.4% might be performing exceptionally well for that vertical, while a dating or entertainment account at the same 4.4% would be underperforming. The honest answer is: a good CTR is one that beats your specific industry benchmark and still supports profitable conversions downstream. Chasing a high CTR in isolation, without checking what happens after the click, is how a lot of ad budgets get wasted.
What CTR Actually Measures
Click-through rate is the percentage of people who saw your ad and clicked it. Impressions divided by clicks, multiplied by 100. If your ad showed up 5,000 times and got 175 clicks, that’s a 3.5% CTR.
What makes it useful isn’t the math, it’s what the number implies. CTR is Google’s proxy for relevance. When your ad matches what someone typed into the search bar, they click. When it doesn’t, they scroll past. Google feeds this signal directly into Quality Score, which in turn affects your cost per click and your ad rank in the auction. A stronger CTR often means cheaper clicks and better positioning, not just more traffic. That’s the real reason this metric gets so much attention, it’s not vanity, it’s mechanically tied to what you pay.
If you want to run the calculation on your own numbers without doing it by hand, the CTR calculator handles it in a few seconds.
2026 Google Ads CTR Benchmarks
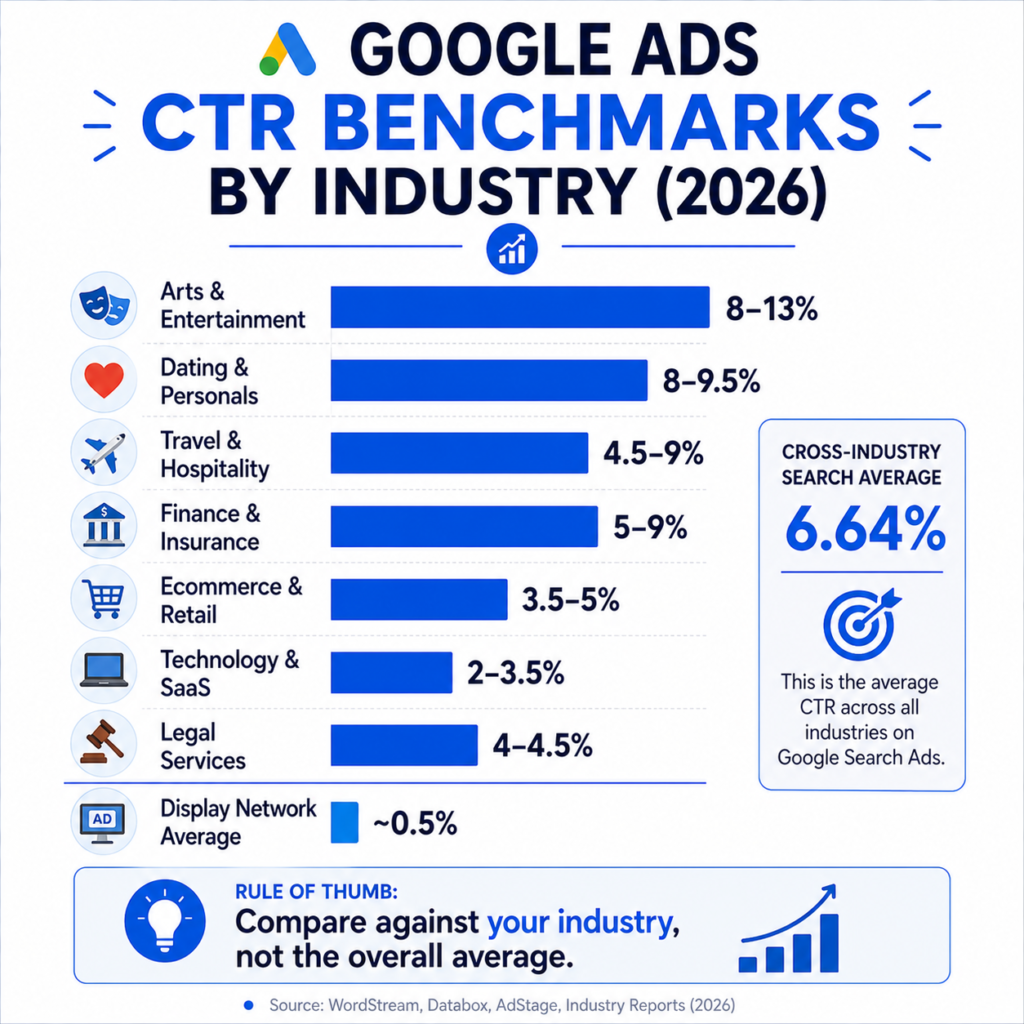
Benchmark reports vary depending on the dataset behind them, but WordStream’s 2026 Search Advertising Benchmarks report, now in its tenth year and drawn from over 13,000 US campaigns, remains the most widely cited reference point. It puts the cross-industry average Search CTR at 6.64%, alongside an average CPC of $5.42 and a conversion rate of 8.18%.
Other independent benchmark sets land in a similar range, generally between 6% and 6.8% for the cross-industry Search average, which suggests the WordStream figure is a reasonable anchor rather than an outlier.
| Industry | Typical Search CTR Range |
| Arts & Entertainment | 8% – 13% |
| Dating & Personals | 8% – 9.5% |
| Charity & Non-profit | 7% – 8.5% |
| Travel & Hospitality | 4.5% – 9% |
| Finance & Insurance | 5% – 9% |
| Home Improvement | 5% – 7% |
| Ecommerce & Retail | 3.5% – 5% |
| Automotive | 3.5% – 6% |
| Health & Fitness | 3.5% – 5% |
| Technology & SaaS | 2% – 3.5% |
| Legal Services | 4% – 4.5% |
| Industrial & B2B Manufacturing | 3.5% – 4.2% |
These ranges reflect the spread across several 2026 benchmark studies rather than one single source, since methodologies differ slightly between reports. The pattern holds up consistently though: consumer categories with broad emotional appeal (entertainment, dating, travel) cluster toward the top, and narrow B2B or highly technical categories cluster toward the bottom. That’s not a quality judgment on B2B advertisers, it’s a reflection of smaller, more skeptical audiences who click less often even when the ad is well matched to them.
For a deeper industry-by-industry breakdown, our average CTR by industry guide covers more verticals in detail. And if you’re specifically trying to figure out whether a 2% rate is acceptable for your account, we’ve broken that scenario down separately in is 2% CTR good for Google Ads.
Search CTR vs Display CTR
These two numbers are not comparable, and treating them as if they are is one of the more common mistakes newer advertisers make.
Search ads appear in response to something a person actively typed, so intent is already high before your ad shows up. Display ads appear while someone is reading an article, scrolling a feed, or watching a video, meaning the person wasn’t looking for anything related to your ad in that moment. That’s why Display CTR averages around 0.46% to 0.5% in 2026, while Search averages sit ten times higher.
If someone tells you their Display campaign is “only” getting a 0.6% CTR, that’s actually a bit above average, not a failure. The benchmark comparison has to happen within the same network.
A Realistic Example: Agency Managing Two Accounts
A small agency running paid search for two clients illustrates this well. Client A is a home improvement company running Search ads for “kitchen remodel contractor near me” and similar terms. Client B is a B2B SaaS company selling inventory management software to mid-size warehouses.
Client A’s account runs at 6.8% CTR. Client B’s account runs at 2.9% CTR. On paper, Client A looks like it’s outperforming Client B by more than double. But home improvement benchmarks typically run 5% to 7%, so Client A is sitting right around expected performance. B2B software benchmarks typically run 2% to 3.5%, so Client B, at 2.9%, is also performing within a healthy range for its category.
Neither number tells you anything meaningful on its own. What matters is each account’s CTR relative to its own industry benchmark, and then, more importantly, what each click actually costs to convert. If Client B’s 2.9% CTR is producing qualified demo requests at a reasonable cost per acquisition, that account is doing its job even though the raw percentage looks unimpressive next to Client A’s.
When a High CTR Isn’t Actually Good News
This trips up a lot of advertisers, usually the ones newer to paid search who assume more clicks automatically means more revenue.
A CTR can climb for reasons that have nothing to do with sales. Broad match keywords sometimes pull in curiosity clicks from people who were never going to buy. Aggressive or slightly misleading ad copy can inflate clicks while tanking conversion rate, since the people who land on the page realize quickly that it isn’t what they expected. Ad extensions and sitelinks also naturally lift CTR by giving people more places to click, which is good, but it can make a CTR increase look like a strategy win even when nothing about targeting or messaging actually improved.
The way to catch this is simple: look at CTR and conversion rate together, never CTR alone. If your CTR goes up 20% and your conversion rate drops 25%, you didn’t improve the campaign, you just changed who’s clicking. Our CTR vs CPC comparison walks through how these metrics interact with cost, and the ROAS calculator is a fast way to check whether that extra traffic is actually paying for itself.
When a Low CTR Isn’t Actually a Problem
The reverse happens too. Some keyword categories are inherently low-CTR by nature, and that’s fine as long as the conversions justify the spend.
Broad, top-of-funnel keywords (“what is inventory management software,” for example) tend to attract a lot of impressions from people still researching, many of whom won’t click at all. That’s expected. It doesn’t mean the keyword should be paused, it means it’s playing a different role in the funnel than a bottom-of-funnel keyword like “buy inventory management software” would.
Highly competitive auctions with several strong advertisers bidding on the same terms also naturally spread clicks across more ads, which pulls down everyone’s individual CTR even when each ad is well written. If you’re in a crowded vertical, comparing yourself to a benchmark drawn from less competitive categories will make your numbers look worse than they are.
If your CTR genuinely does look off relative to your industry and campaign type, our why is my CTR so low article walks through the specific diagnostic steps.
What Actually Moves CTR
A few factors consistently separate accounts that beat their benchmark from ones that sit below it:
- Ad copy specificity. Ads that mention a specific price, timeframe, or outcome tend to outperform generic value propositions. “Free quote in 24 hours” beats “Contact us today” almost every time it’s tested.
- Keyword-to-ad alignment. Tight ad groups built around a handful of closely related keywords let you write copy that mirrors the search term almost exactly, which Google rewards with both higher CTR and better Quality Score.
- Ad extensions. Sitelinks, callouts, and structured snippets increase the physical size of your ad on the results page, which alone tends to lift CTR without any copy changes.
- Match type strategy. Broad match without smart bidding guardrails tends to dilute CTR by matching to loosely related searches. Phrase and exact match generally produce tighter, higher-CTR traffic, though at lower volume.
- Device and schedule targeting. CTR often differs meaningfully by device and time of day. An account that hasn’t reviewed its device breakdown in months is usually leaving performance on the table.
None of these are secret techniques, they’re the same fundamentals experienced PPC managers check first when a CTR sits below where it should be.
How to Check Where You Stand
Pull your CTR at the campaign level and the ad group level separately, since a healthy account average can hide a handful of ad groups that are dragging performance down. Compare each ad group against the industry range that fits it most closely, not just the account-wide average. Then check what that CTR is producing in terms of cost per click and conversion rate before deciding anything needs to change.
For teams tracking this across multiple campaigns and metrics at once, the marketing KPI dashboard keeps CTR next to CPC, conversion rate, and CPA so you’re not jumping between separate reports to see the full picture. If you want the underlying formulas for CTR alongside other Google Ads metrics in one place, the Google Ads formula library covers those.
Common Misconceptions
“A higher CTR always means a better campaign.” Not necessarily, as covered above. It means more people are clicking, which is only good news if those people convert at a reasonable rate.
“There’s one universal good CTR number.” There isn’t. Benchmarks vary by industry, network (Search vs Display), device, and even keyword intent within the same account.
“Low CTR always means bad ad copy.” Sometimes it’s the keyword strategy, the competitive landscape, or a mismatch between the search term and the funnel stage, not the copy itself.
“CTR benchmarks are static.” They shift year to year. WordStream’s own data shows CTR has roughly tripled since 2016, driven by responsive search ads, more ad extensions, and AI-generated assets. A benchmark from three years ago may not reflect what’s realistic today, so it’s worth checking updated figures periodically rather than anchoring to old numbers.
Benchmarks are a useful reference point, not a scoreboard. The number that actually matters is whether your clicks are turning into the outcome you’re paying for. If your CTR looks fine but conversions don’t follow, the issue usually isn’t the click-through rate at all, it’s what happens after the click.
Frequently Asked Questions
What is a good CTR for Google Ads in 2026?
Generally, anything above your specific industry’s average is considered good. The cross-industry Search average is around 6.6%, but the range runs from roughly 2% in technical B2B categories to over 10% in entertainment and dating.
Is a 5% CTR good for Google Ads?
For most Search campaigns, yes, 5% sits close to or above average depending on industry. In a low-CTR vertical like B2B software or legal services, 5% would be a strong result. In a high-CTR vertical like arts and entertainment, it would be below average.
Why is Display CTR so much lower than Search CTR?
Display ads reach people who weren’t actively searching for anything related to the ad, while Search ads respond to an active query. The intent gap is why Display averages sit around 0.5% compared to Search’s 6%-plus average.
Does a high CTR lower my CPC?
Often, yes. CTR feeds directly into Quality Score, and a higher Quality Score typically earns better ad rank at a lower cost per click. It’s not a guaranteed 1:1 relationship, but the correlation is well documented.
Sources and methodology
This article uses external Google Ads benchmark data as context, not as a universal definition of a good CTR. The primary comparison source is LocaliQ/WordStream’s 2026 search advertising benchmark report. Use the numbers only after matching campaign network, industry, geography, intent, and conversion quality.