Conversion rate is one of those metrics that sounds simple until you try to benchmark it. A SaaS company celebrating a 4% trial signup rate and an ecommerce brand panicking over the same number are both reacting to a figure that means something completely different in their world. Before you decide whether your rate is good, bad, or somewhere in between, it helps to know what the actual data says by industry, by traffic type, and by what “conversion” even means for your business.
This guide pulls together the most current 2026 benchmark data across ecommerce, lead generation, landing pages, and SaaS trials, and walks through how to use it without falling into the comparison trap that makes most benchmark articles useless.
The Short Answer
For most ecommerce stores, a good sitewide conversion rate falls between 2% and 3.5%, with high-frequency, low-consideration categories like food and beverage running higher and big-ticket categories like luxury goods running lower. For lead generation businesses, a good conversion rate on a dedicated landing page sits somewhere between 5% and 10%, while general website traffic (blog posts, homepage, category pages) typically converts at 2% to 3%. For B2B SaaS free trials, 15% to 25% is a reasonable target for opt-in trials, though this number swings wildly depending on whether a credit card is required.
None of those numbers matter much on their own. What matters is comparing your rate to the right slice of data: same industry, same traffic source, same funnel stage, same device mix. That’s the part most benchmark lists skip.
Ecommerce Conversion Rate by Industry (2026)
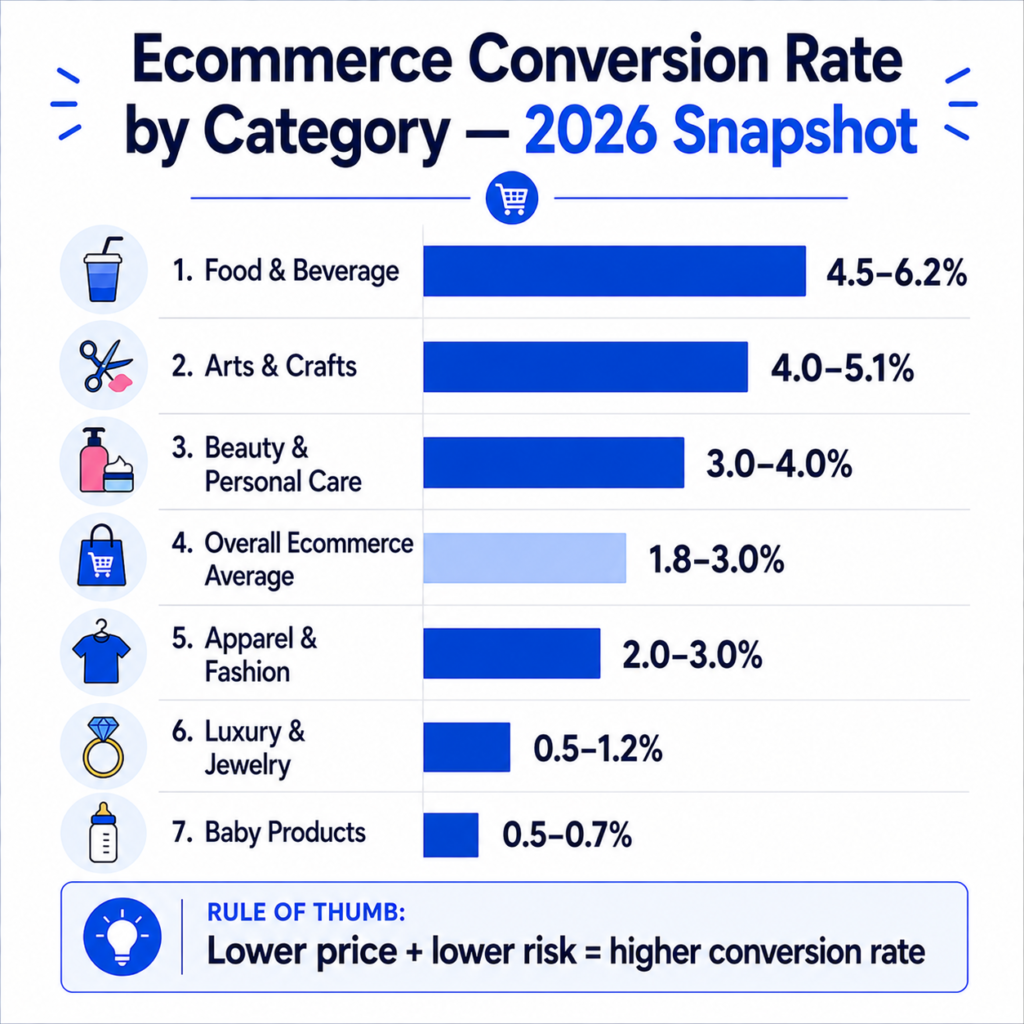
Ecommerce benchmarks are usually reported as sitewide conversion rate: total orders divided by total sessions. The global average lands in the 1.8% to 3% range depending on the data source, with the IRP Commerce platform benchmark reporting a 1.99% average in December 2025, down slightly from 2.18% the year before. That dip mostly reflects rising ad costs and tighter traffic budgets pushing more low-intent visitors into the funnel, not a sudden drop in site quality across the board.
Here’s how that average breaks down by category:
| Industry | Typical Conversion Rate (2026) |
| Food & Beverage | 4.5% – 6.2% |
| Arts & Crafts | 4.0% – 5.1% |
| Beauty & Personal Care | 3.0% – 4.0% |
| Retail (blended average) | ~2.3% |
| Apparel & Fashion | 2.0% – 3.0% |
| Overall ecommerce average | 1.8% – 3.0% |
| Luxury & Jewelry | 0.5% – 1.2% |
| Baby Products | 0.5% – 0.7% |
The pattern here is consistent with basic purchase psychology. Cheap, frequent, low-risk purchases convert at a higher rate because there’s little to think about. A $14 candle or a $22 skincare product doesn’t require research, comparison shopping, or a second opinion from a partner. A $3,000 engagement ring or a $400 stroller does, and that consideration phase shows up directly in a lower conversion rate, even when the store itself is well built.
If you’re running paid traffic to an ecommerce store and want to know whether your spend is translating into profit rather than just orders, it’s worth pairing your conversion rate with a ROAS calculator and a net profit calculator side by side. A store converting above the industry average can still be losing money per order if margins and returns aren’t accounted for.
Lead Generation and Landing Page Conversion Rates by Industry (2026)
Lead gen is measured differently, and this is where a lot of benchmark confusion starts. A “conversion” here usually means a form fill, a call booking, or a quote request, not a completed sale. That changes the math significantly, because a form fill has a much lower commitment threshold than handing over a credit card number.
Unbounce’s landing page analysis (covering tens of millions of visits across dedicated landing pages) reported a median conversion rate around 6.6%, with some newer 2026 datasets covering a broader set of industries pushing that median toward 8%. General website pages that aren’t built as focused landing pages convert at a noticeably lower rate, closer to 2.35% by WordStream’s cross-industry data. That’s nearly a 3x gap, and it’s almost entirely explained by focus: a dedicated landing page has one offer and one call to action, while a blog post or homepage is competing with navigation menus, related content, and a dozen other distractions.
| Industry | Typical Landing Page / Lead Form Conversion Rate |
| Events & Entertainment | ~12.3% |
| Finance & Legal (lead forms) | ~12.3% median |
| Financial Services (landing pages) | 5.1% – 8.4% |
| Real Estate | ~7.4% |
| SaaS & Technology | 3.8% – 9.5% (wide spread by source) |
| Hotels & Resorts | ~3.7% |
| Retail & Travel (lead forms) | ~3.8% median |
| Engineering | ~1.1% |
Notice the SaaS row has an unusually wide range. That’s not sloppy research, it reflects genuinely different measurement methods across studies, some counting only paid traffic, others blending organic and direct visitors, and some using median while others report mean. When a category shows that kind of spread across otherwise reputable sources, treat any single number with caution and focus on the direction rather than the decimal point.
For form-based lead gen, form length has an outsized effect that industry alone doesn’t capture. Three-field forms convert meaningfully better than nine-field forms in the same industry, sometimes by a factor of nearly 3x. If your form is long and your rate is low, that’s often a form problem before it’s an industry problem.
B2B SaaS Free Trial Conversion: A Different Metric Entirely
This one deserves its own section because “SaaS conversion rate” gets used to describe at least three different things: landing page visits to trial signups, trial signups to paid customers, and freemium users to paid customers. Mixing these up is one of the most common mistakes in SaaS marketing reporting.
For trial-to-paid conversion specifically, the 2026 data clusters around a few consistent patterns:
- Opt-in free trials (no credit card required): roughly 8% to 22%, with a median near 14–18%
- Opt-out free trials (credit card required upfront): roughly 35% to 55%, because canceling takes more effort than doing nothing
- Freemium to paid: typically just 2% to 8%, since free-tier users have far less urgency to upgrade
The gap between opt-in and opt-out isn’t really a marketing skill gap, it’s a friction design choice. Requiring a card at signup filters for higher intent and relies on default behavior (not canceling) to drive revenue. Neither approach is objectively better, they optimize for different things: opt-in maximizes top-of-funnel volume and brand trial, opt-out maximizes revenue per signup at the cost of some negative sentiment from unintentional charges.
If you’re tracking how efficiently trial users turn into long-term revenue, it’s worth looking at this alongside your LTV calculator and CAC calculator results. A high trial conversion rate with a poor LTV:CAC ratio usually points to an acquisition targeting problem, not a trial design problem. Our guide on what counts as a good LTV:CAC ratio breaks that relationship down further.
Average vs. Median: Why Two “Correct” Numbers Can Disagree
A lot of the apparent contradictions in conversion rate data come down to one thing: average and median are not the same measurement, and most articles don’t say which one they’re reporting.
Average (mean) conversion rate adds up every business’s rate and divides by the count. One outlier, say, a brand running a 40% conversion rate off a tiny, hyper-targeted referral list, can drag the average upward for an entire category. Median conversion rate takes the middle value when every business is lined up in order. It’s far less sensitive to extreme outliers and usually gives a more realistic picture of what a typical business actually experiences.
This is why you’ll sometimes see the same industry reported at both 2.35% and 6.6% depending on the source: one is measuring general website traffic (a much larger, noisier pool), and the other is measuring dedicated landing pages built specifically to convert. Both numbers are correct. They’re just answering different questions.
The Real Factors Behind Industry Benchmarks
Industry is a useful starting point, but four other variables usually move the needle more than the industry label itself.
Average order value and purchase complexity. Low-price, low-commitment purchases convert at a higher rate almost regardless of industry. This is the single biggest driver of the ecommerce spread shown earlier.
Traffic source. Referral and email traffic convert noticeably higher than paid social, because the visitor already has context or a relationship with the brand. Comparing your paid social conversion rate to a blended industry average that includes email traffic will make your numbers look worse than they are.
Device mix. Desktop sessions still convert meaningfully higher than mobile in most categories, even though mobile now drives the majority of traffic for most retailers. If your traffic is 70% mobile and the benchmark you’re comparing against skews desktop-heavy, expect a gap that has nothing to do with your funnel quality.
Sales cycle and buying committee size. A five-figure B2B software purchase involves more stakeholders and more deliberation than a $40 ecommerce order. Comparing a long-cycle B2B lead form to a same-day ecommerce checkout is comparing two fundamentally different decision processes.
Realistic Examples: What “Good” Actually Looks Like
Ecommerce apparel store. A mid-size apparel brand runs 45,000 monthly sessions and converts at 2.4%, generating roughly 1,080 orders. That’s squarely in the “good” range for apparel (2–3%), even though it would look weak compared to a food and beverage brand converting at 5%. The apparel store shouldn’t chase a 5% target, it should benchmark against apparel peers and focus on reducing cart abandonment instead.
Local HVAC service business. A local contractor gets 900 monthly visits to a dedicated quote-request landing page and converts 63 of them into form submissions, a 7% rate. That sits comfortably above the general lead-gen median and reflects strong message match between the ad copy and the page. The bigger opportunity here isn’t the landing page, it’s how many of those 63 leads actually become paying jobs, which is a sales follow-up question, not a marketing one.
B2B SaaS with a 14-day free trial. A project management SaaS tool converts 16% of trial signups to paid, right at the median for opt-in trials. Rather than obsessing over squeezing that to 20%, the growth team finds more leverage in shortening time-to-first-value inside the trial, since activation rate drives the majority of the variance in trial conversion outcomes.
Marketing agency landing page. An agency’s “free audit” landing page converts at 4.5%, below the 5–10% range typically seen for agency and legal-style landing pages. Digging into the traffic source shows most visits are coming from cold LinkedIn ads rather than referral or search traffic, which explains a chunk of the gap before any page redesign is needed.
Common Mistakes When Comparing to Industry Benchmarks
- Comparing sitewide traffic to landing page benchmarks. These measure fundamentally different funnels and will never line up.
- Ignoring traffic source mix. A blended conversion rate across five channels tells you less than segmenting by channel first.
- Treating average as a target. If the average is being pulled up by a handful of outliers, chasing it can lead you to optimize for the wrong thing.
- Benchmarking against the wrong business model. Comparing a freemium SaaS product’s conversion rate to an opt-out trial benchmark will always look disappointing, because they’re structurally different motions.
- Forgetting device split. A 2% mobile-heavy site and a 2% desktop-heavy site are not performing the same, even though the headline number matches.
When a Below-Average Conversion Rate Is Actually Fine
Not every low number is a problem. A high-ticket B2B software company converting at 1.5% on cold paid traffic might be perfectly healthy if the deals that do close are worth $50,000 in annual contract value. A luxury retailer converting at 0.8% might be outperforming its category if most of that traffic is genuinely cold, top-of-funnel brand awareness rather than purchase-intent traffic.
The more useful question usually isn’t “is my conversion rate good?” It’s “is my conversion rate improving relative to my own baseline, and is the resulting revenue covering my acquisition cost with room for profit?” Running your numbers through a CPA calculator or a break-even ROAS calculator will usually tell you more about whether your funnel is healthy than a raw industry comparison ever will. Our post on ROAS that looks good but isn’t actually profitable covers a closely related version of this same trap.
How to Benchmark Your Own Rate the Right Way
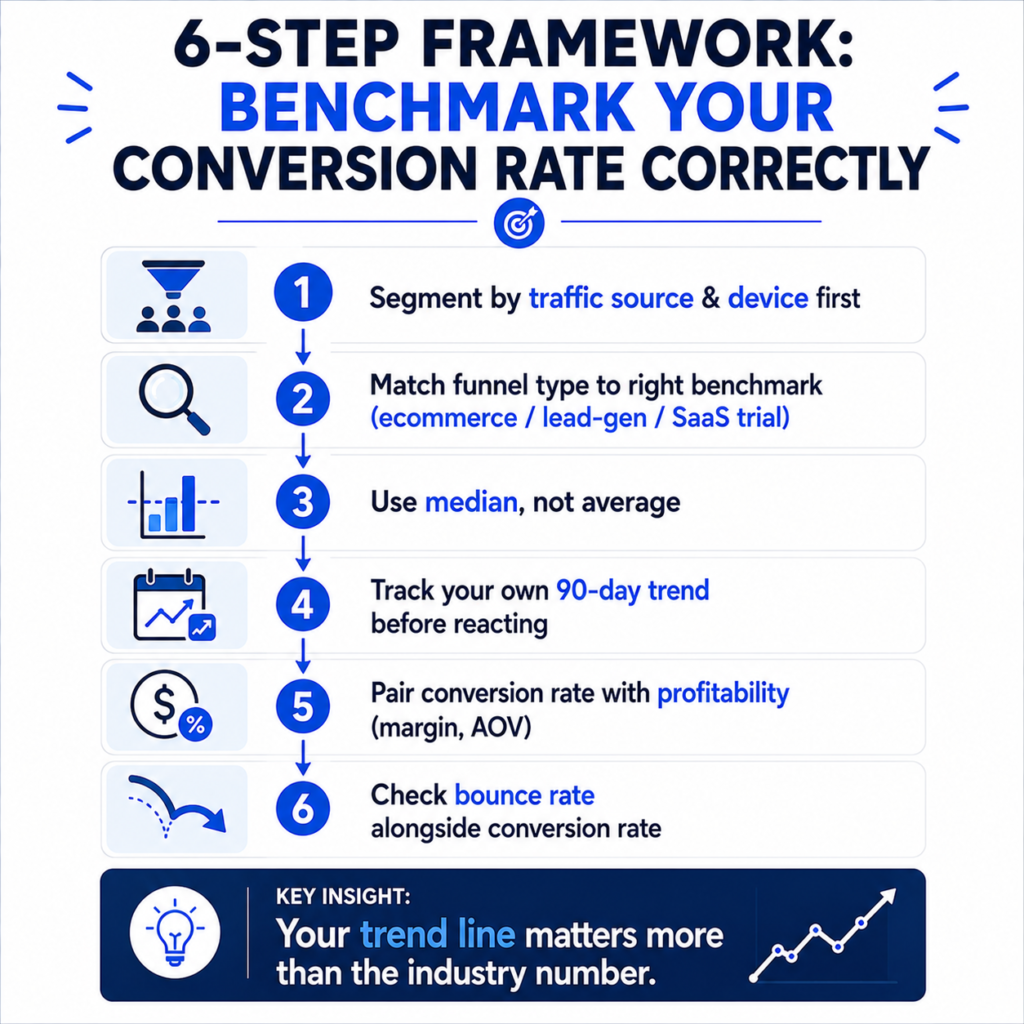
- Segment before you compare. Pull conversion rate by traffic source, device, and landing page before looking at the sitewide number.
- Match your funnel type to the right benchmark table. Ecommerce checkout, lead form, and SaaS trial are three separate benchmark categories, not one.
- Use median data over average when it’s available. It’s a more honest reflection of “typical” performance in your category.
- Track your own trend line for 90 days before reacting to any external benchmark. A short-term dip after a platform algorithm change often self-corrects.
- Pair conversion rate with profitability metrics. A profit margin calculator or AOV calculator will tell you whether a rising conversion rate is actually adding revenue you can keep.
- Watch bounce rate alongside conversion rate. A page with high bounce and low conversion usually has a message-match problem before it’s a form-length problem. The bounce rate calculator is a fast way to check this, and our guide on what counts as a good bounce rate goes deeper into reading that number correctly.
If you’re managing several campaigns at once, a centralized view makes this segmentation much easier than pulling reports from five different platforms. Our marketing KPI dashboard is built for exactly that kind of side-by-side tracking, and the marketing KPI formula library is a useful reference if you want the underlying formulas rather than a black-box number.
Understanding where your conversion rate sits relative to the right benchmark is only useful if you also know what that traffic is actually costing you and returning in profit. Explore the full set of marketing and advertising calculators to connect your conversion data to CAC, ROAS, and lifetime value in one place, or browse all tools if you’re looking for something more specific to your funnel.
Frequently Asked Questions
What is a good conversion rate overall in 2026?
There isn’t one universal number. For ecommerce, 2% to 3.5% sitewide is typical. For dedicated lead-gen landing pages, 5% to 10% is a reasonable target. Always compare within your own category and traffic type rather than against a blended cross-industry figure.
Why do different websites report different “average” conversion rates for the same industry?
Usually because they’re measuring different things: sitewide traffic versus dedicated landing pages, mean versus median, or paid traffic only versus all traffic blended together. Check the methodology before comparing your number to a headline statistic.
Is a 1% conversion rate bad?
Not necessarily. For luxury goods, enterprise software, or high-ticket B2B services, 1% can be entirely normal given the size and complexity of the purchase decision. It’s a poor sign mainly when it’s well below the typical range for your specific category and traffic type.
Does traffic source affect what counts as a good conversion rate?
Yes, significantly. Email and referral traffic consistently convert higher than cold paid social traffic across almost every industry, because the visitor already has more context or trust going in. Segment by channel before judging your overall rate.
How is ecommerce conversion rate different from lead generation conversion rate?
Ecommerce conversion rate measures completed purchases, which involves a financial commitment. Lead generation conversion rate typically measures a form submission or call booking, which has a much lower commitment threshold. That’s why lead-gen benchmarks often look higher than ecommerce benchmarks even in related industries.
Sources and methodology
Conversion-rate benchmarks are especially sensitive to definition. A Google Ads conversion rate is not the same as an ecommerce store conversion rate, lead-form conversion rate, free-trial activation rate, or all-traffic website conversion rate. This article treats benchmark numbers as directional context and separates the meaning of the metric from the source and channel whenever possible.