If you’ve ever looked at your CTR and thought “is this actually good?”, you already understand why industry benchmarks matter. A 3% CTR in legal paid search means something entirely different from a 3% CTR in retail email – one is below average, the other is above it. Without the right comparison point, the number by itself tells you almost nothing.
This guide pulls from current 2026 benchmark data across paid search, display advertising, email, and organic search, organized by industry. Whether you’re managing Google Ads for a SaaS company or running email campaigns for a B2B manufacturer, you’ll find concrete numbers to work with here – along with enough context to actually use them.
What CTR Measures (and Where It Falls Short)
Click-through rate is clicks divided by impressions, multiplied by 100. If 500 people saw your ad and 25 clicked it, your CTR is 5%. Simple enough.
What gets complicated is interpreting the number in isolation. A high CTR means your messaging is resonating with whoever sees it – but it doesn’t tell you whether those people are the right audience, whether they convert, or whether the traffic is profitable. A campaign with a 12% CTR that barely converts is not a good campaign. A campaign with a 4% CTR and a healthy conversion rate might be your best performer.
CTR is genuinely useful for:
- Diagnosing ad copy or subject line performance
- Evaluating Quality Score components in Google Ads (higher CTR contributes to better Quality Score, which lowers CPC)
- Spotting engagement drops before they affect conversion volume
- Comparing creative variations in A/B tests
It’s less useful when treated as the primary measure of campaign success. The actual measure of campaign health is cost per acquisition relative to customer value. Use the CTR Calculator at QuickMarketingTools to quickly work out CTR from raw click and impression data, then pair it with downstream metrics to get the full picture.
Paid Search CTR by Industry (Google & Microsoft Ads, 2026)
Search ads benefit from something display and email can’t replicate: the person who sees your ad was actively looking for something relevant to what you’re selling. That intent alignment is why search CTR runs so much higher than other channels.
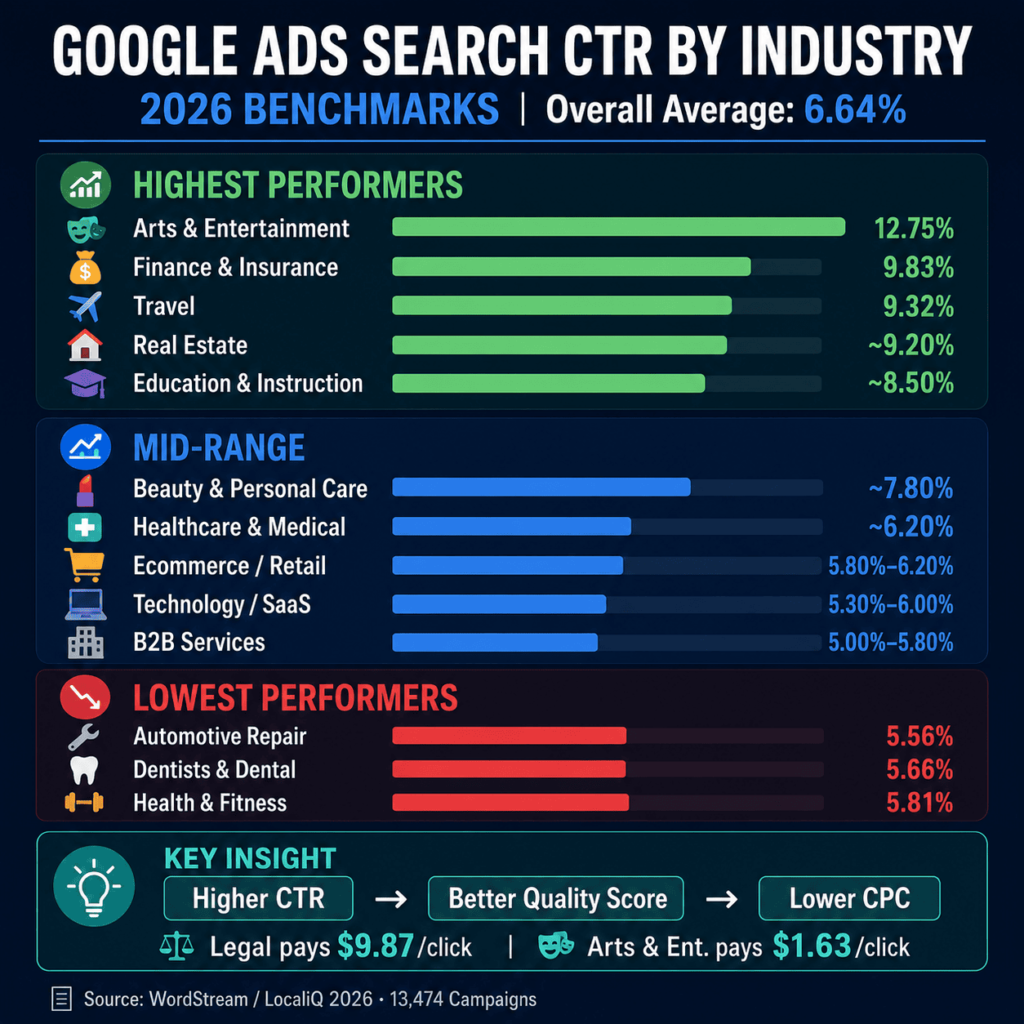
According to WordStream’s 2026 benchmark report, analyzing over 13,000 campaigns running between April 2025 and March 2026, the average click-through rate in Google Ads in 2026 is 6.64%. That figure is nearly unchanged from 2025, which indicates that overall paid search engagement has remained relatively stable – a stable average doesn’t mean every account is performing well, but it means the market as a whole isn’t experiencing a broad collapse or surge in ad engagement.
Here’s how the numbers break down by industry:
| Industry | Avg. Search CTR (2026) |
| Arts & Entertainment | 12.75% |
| Finance & Insurance | 9.83% |
| Travel | 9.32% |
| Real Estate | ~9.20% |
| Education & Instruction | ~8.50% |
| Sports & Recreation | ~8.00% |
| Beauty & Personal Care | ~7.80% |
| Home & Home Improvement | ~6.37% |
| Healthcare & Medical | ~6.20% |
| Ecommerce / Retail | ~5.80%–6.20% |
| Technology / SaaS | ~5.30%–6.00% |
| B2B Services | ~5.00%–5.80% |
| Attorneys & Legal Services | ~5.56%–6.00% |
| Dentists & Dental Services | 5.66% |
| Automotive (Repair & Service) | 5.56% |
| Health & Fitness | 5.81% |
A few things stand out in this data worth explaining rather than just noting.
Finance & Insurance jumped significantly. It now sits at 9.83%, making it the second-highest industry in the dataset. WordStream’s expert commentary attributes this partly to economic concerns driving more searches for financial and insurance help – people actively seeking these services in an uncertain economic environment are more likely to click when an ad matches their query.
Arts & Entertainment remains far above the pack. At 12.75%, it’s nearly double the overall average. This category attracts curiosity-driven searches where people aren’t comparing multiple vendors – they want to know more about a specific event, show, or experience. Intent and ad match almost perfectly, so clicks come naturally.
Automotive Repair, Dental, and Health & Fitness sit at the bottom. Automotive Repair came in at 5.56%, followed by Dentists and Dental Services at 5.66% and Health and Fitness at 5.81%. These aren’t failing categories – they’re just high-consideration searches where users carefully read what’s available before clicking anything. Health searches in particular have gotten more complex as Google surfaces more information directly in the SERP.
Technology and SaaS fall in the 5-6% range. This reflects the longer consideration cycles inherent to software buying. Someone searching for project management software or a CRM isn’t making a same-day decision. They’re researching, and the CTR reflects that measured intent.
The CTR-CPC Relationship Nobody Explains Clearly
One of the more useful patterns in this data is the inverse relationship between CTR and CPC across industries. Arts & Entertainment leads CTR at 12.75% while Legal Services sits near the bottom – and this inverse relationship exists because high CTRs improve Quality Score, which directly lowers cost per click.
Put plainly: if your ads get clicked more, Google rewards you with lower costs per click because it signals your ads are relevant to the queries they match. Legal and dental advertisers aren’t just stuck with low CTR – they’re also paying a higher price for every click they do get. In high-CPC categories like Legal Services at $9.87 average CPC and Dental at $8.00 average CPC, more advertisers compete for fewer ad slots, which further suppresses individual ad performance.
This is why improving CTR in a competitive, low-CTR vertical like B2B technology or legal services has a compounding financial benefit – better ad copy gets you more clicks and you pay less per click as a result.
Display Ad CTR by Industry (2026)
Display advertising operates on fundamentally different logic than search. Users browsing websites aren’t looking for what you’re selling – they’re consuming content, and your ad is an interruption. Naturally, CTRs are far lower, and comparing them to search benchmarks is a mistake that leads to bad decisions.
The average CTR on the Google Display Network is 0.46% across all industries. Search CTR averages roughly 680% higher than display, with the gap widest in consumer-facing categories.
| Industry | Avg. Display CTR (2026) |
| Real Estate | ~1.08% |
| Healthcare | ~0.71% |
| Finance & Insurance | ~0.60% |
| Ecommerce / Retail | ~0.50%–0.60% |
| Technology / SaaS | ~0.46% |
| Home & Garden | ~0.45% |
| B2B Services | ~0.22% |
B2B services record the lowest display engagement at 0.22%, reflecting the complex decision-making processes in business purchasing. This is the lowest of any industry, and it makes intuitive sense. A procurement manager evaluating enterprise software isn’t going to click a banner ad they saw while reading a trade publication. Display can still contribute to brand awareness and retargeting in B2B, but the CTR will always look modest.
Real estate display ads achieve the highest CTR at 1.08%, driven by high-intent audiences actively researching property purchases. People browsing real estate content are often mid-research on a major purchase decision, making them unusually receptive to relevant display placements.
One thing that matters more than industry average for display: whether you’re running prospecting or retargeting. Remarketing campaigns consistently outperform prospecting display by 3-5x on CTR. A display CTR of 0.22% for prospecting might become 0.8% or higher for a well-segmented retargeting audience. The industry average captures both together, which compresses the numbers.
For calculating the economics of display campaigns at scale, the CPM Calculator helps you work out reach and cost efficiency before committing budget.
Email CTR by Industry (2026)
Email CTR is the metric most worth paying attention to in 2026, and not just because it reflects campaign performance. CTR requires a deliberate click from a real human, which makes it the most reliable engagement benchmark in an era when Apple Mail Privacy Protection inflates open rates by an estimated 15 to 20 percentage points. Open rates are increasingly unreliable for measuring actual engagement. CTR is not.
Click-through rates average 2.44% across all industries in 2026, and CTR is now considered the more reliable primary benchmark as open rates continue to be inflated by Apple Mail Privacy Protection.
That said, the variance across sources is significant and worth flagging. Klaviyo reports 1.69% for marketing campaigns from ecommerce-heavy senders, while ActiveCampaign reports 6.21% including transactional emails – a 3.7x gap between two reputable platforms measuring the same metric with different methodologies. The benchmark you use as a reference should match what you’re actually sending.
For standard broadcast marketing campaigns, the 2-2.5% range is a reasonable baseline. Here’s how industries compare:
| Industry | Avg. Email CTR (2026) |
| Blogger / Author | ~7.73% |
| Media / Publishing | ~7.32% |
| Consulting / Agency | ~7.05% |
| Software / Tech (B2B) | ~6.67% |
| Online Education | ~6.38% |
| Legal | ~4.90% |
| Ecommerce / Retail | ~1.7%–2.0% (campaigns) |
| Finance & Insurance | ~2.8%–3.0% |
| Government | ~4.1%–4.8% |
| Healthcare | ~2.5% |
The B2B software number (6.67%) looks high relative to the overall average, but it reflects the nature of those lists. B2B tech email subscribers tend to be opted-in professionals who actively want product updates, feature announcements, and industry content. List quality dominates CTR more than any other single factor in email.
Automated flows average significantly higher CTR than broadcast campaigns – Klaviyo’s 2026 data puts flow CTR at 5.58% versus 1.69% for manual campaigns. The gap comes entirely from timing and relevance. A welcome email or abandoned cart sequence arrives when someone just demonstrated intent. A weekly newsletter competes with everything else in the inbox that day.
One development worth noting for 2026: Google launched an AI-powered inbox for Gmail in January 2026, which automatically categorizes and surfaces emails by predicted relevance – campaigns with strong historical engagement are prioritized, while low-engagement lists face suppression risk. If your email CTR has dropped unexpectedly in early 2026, Gmail’s AI categorization is worth investigating alongside content quality.
Organic Search CTR in 2026: A Channel Under Pressure
Organic CTR deserves its own section because the landscape has shifted substantially over the past 18 months – primarily due to AI Overviews expanding across Google’s search results.
Historically, position 1 in organic search captured somewhere around 25-28% of clicks. A study analyzing 200,000+ keywords found that position 1 organic CTR dropped from 28% to 19% – a 32% decline – as AI Overviews became prevalent across query types.
When AI Overviews are displayed in search results, organic CTR decreases by approximately 67.8% compared to when they’re not shown. Similarly, paid CTR sees a reduction of around 58.0%. That’s a structural shift, not a temporary fluctuation.
Here’s how organic CTR typically breaks down by position in 2026:
| SERP Position | Avg. Organic CTR |
| Featured Snippet (#0) | ~42.9% |
| Position 1 | ~19% |
| Position 2 | ~12.6% |
| Position 3 | ~7%–10% |
| Positions 4–10 | ~1%–5% |
| Positions 11+ | <1% |
The top 3 organic search results still receive more than two-thirds of all clicks on the Google Search page. That concentration hasn’t changed even as individual position CTRs have declined – the drop affects everyone equally, so the relative advantage of ranking higher remains intact.
By industry, organic CTR follows some predictable patterns:
- Information-heavy verticals (healthcare, finance, legal) face more AI Overview interference because those queries often have clear factual answers Google can surface directly
- Transactional and commercial queries (ecommerce, local services, SaaS pricing) tend to retain stronger CTR because users genuinely need to visit a site to compare options or purchase
- Branded searches drive significantly higher CTR than non-branded regardless of industry, which is why branded keyword protection in paid search matters even for strong organic performers
If your organic CTR forecasts were built on data from 2022 or 2023, they probably need revisiting. A page ranking at position 5 today may pull traffic comparable to what position 3 generated two years ago. Testing title tags and meta descriptions systematically matters more now – the SERP Snippet Preview tool lets you see exactly how your listings appear before making changes.
Industry Spotlights: SaaS, Ecommerce, B2B, Healthcare
SaaS
SaaS companies typically run campaigns across multiple channels simultaneously – paid search for high-intent keywords, display for retargeting, email for onboarding and upsell. Each channel has very different CTR expectations, and treating them the same leads to bad optimization decisions.
- Paid search CTR: ~5-6% for broad category keywords; higher for branded terms
- Display CTR: ~0.46% for prospecting; higher for retargeting
- Email CTR: ~6.67% for B2B tech lists (includes transactional); ~2.5-3% for pure marketing campaigns to opted-in subscribers
The nature of SaaS evaluation means CTR rarely tells the complete story. A mid-funnel campaign targeting “project management software comparison” queries might show a 4% CTR that converts poorly if the landing page is too aggressive with demo requests. SaaS advertisers often need multi-touch attribution to understand what top-of-funnel CTR is actually contributing downstream. Tracking customer acquisition cost and lifetime value alongside CTR gives a much clearer picture of channel efficiency.
Ecommerce
Ecommerce runs the most complex channel mix: search text ads, Shopping campaigns, display remarketing, and email. Each has distinct CTR expectations that shouldn’t be compared against each other.
- Search text ads: ~5.8-6.2% average; higher for branded product queries
- Shopping ads: Typically 1-3% CTR but with stronger purchase intent per click
- Display/remarketing: ~0.5-0.6% baseline; significantly higher for cart abandonment segments
- Email broadcasts: ~1.7-2.0%; behavioral automation sequences average around 5-6%
One pattern that persisted from 2025 into 2026 is worth flagging: rising CTR combined with declining conversion rates. More people are clicking ecommerce ads, but fewer are completing purchases. The gap usually traces back to a mismatch between what the ad promises and what the landing page delivers. A high CTR that doesn’t convert is often a messaging alignment problem, not a targeting success. Calculating ROAS against channel spend is the fastest way to see where that gap is costing you.
B2B Services
B2B advertising has different economics than consumer verticals. A single conversion can represent tens of thousands of dollars in contract value, which justifies much higher CPCs and tolerates lower CTRs than most consumer categories.
- Search CTR: 5-5.8% for well-targeted campaigns
- Display CTR: ~0.22% – the lowest of any tracked industry
- Email CTR: ~7% for curated B2B lists per ActiveCampaign data; ~2-3% for standard broadcast campaigns
B2B display performance often surprises people who expect more from it. At 0.22%, it’s about half the overall average. That’s not necessarily a failure state for B2B – display’s role in a B2B funnel is typically brand awareness and retargeting rather than direct response, so a lower CTR can still deliver value when CPM costs are factored in. The mistake is evaluating B2B display campaigns against direct-response CTR expectations.
LinkedIn paid ads deserve a separate mention for B2B. Sponsored Content on LinkedIn typically runs 0.4-0.6% CTR – lower than Google Search, but the targeting precision on job title, company size, and industry often produces better-quality clicks than broad search terms at higher CPCs.
Healthcare
Healthcare advertising sits in a regulated, sensitive space that shapes how campaigns can be written and what they can claim.
- Search CTR: ~6.20% in 2026 (up from 5.97% in 2025)
- Display CTR: ~0.71% (above the overall industry average)
- Email CTR: ~2.5% for patient communications and health content newsletters
Healthcare search CTR improved in 2026, driven partly by better use of ad extensions and more locally specific copy. The constraint most healthcare advertisers face isn’t targeting – it’s that Google’s ad policies restrict certain medical claims, which limits how direct copy can be. Ads that clearly state the service type, location, and what makes the practice different tend to outperform vague or overly cautious copy in this vertical.
What “Good” Actually Looks Like for Your Campaigns
Image Prompt: A marketing analyst reviewing campaign performance data on dual monitors, sitting at a modern desk with charts visible on both screens, professional office setting, focused expression, warm directional lighting, no readable text visible.
Benchmarks give you a reference range. They don’t give you a target. Here’s how to think about what good means for your specific situation:
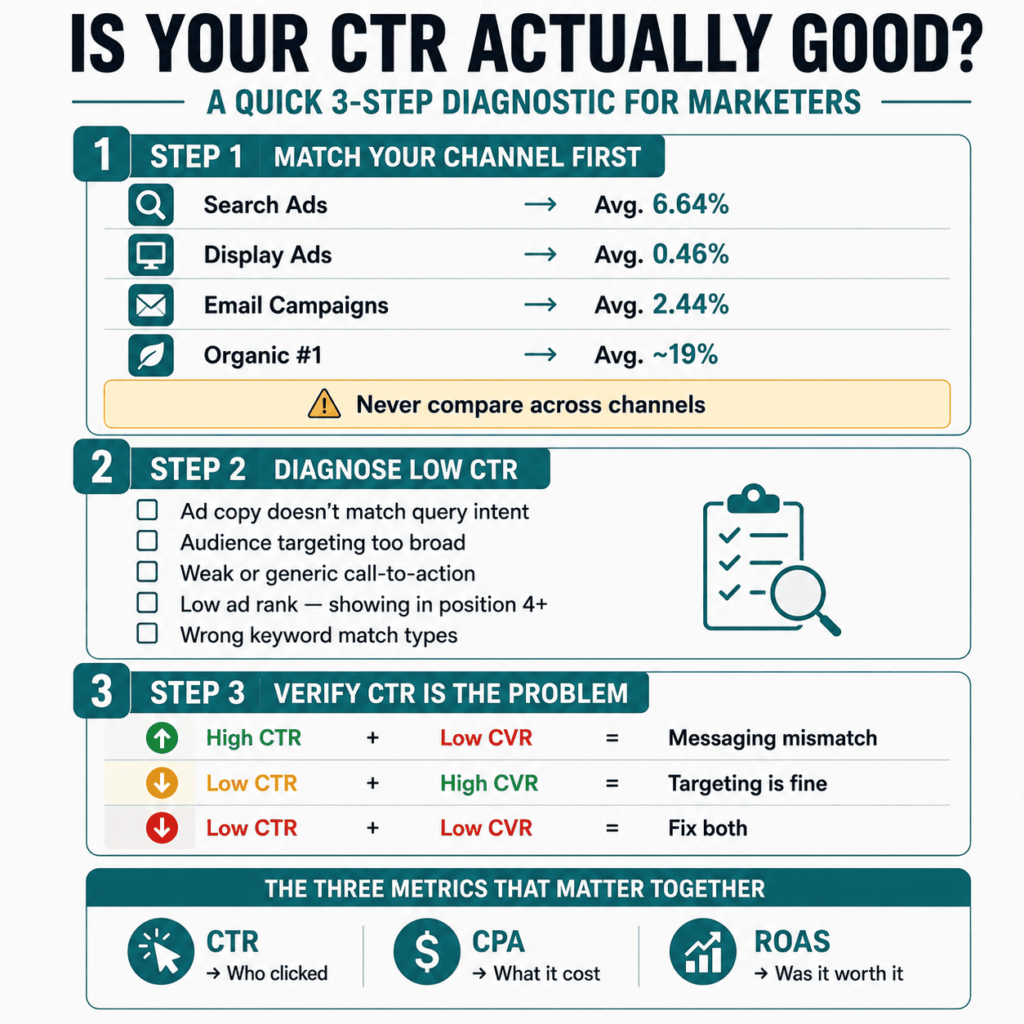
Compare within your channel and industry, not across them. A 2% CTR is excellent for display, workable for email, and underperforming for paid search. Benchmarking a display campaign against search averages produces misleading conclusions every time.
Account age and maturity affect where you’ll land. New campaigns and new ad accounts typically underperform industry averages for the first 60-90 days while data accumulates, Smart Bidding calibrates, and negative keyword lists get refined. A 3% CTR in month one of a well-structured search campaign might reach 6% by month four without substantive changes to targeting.
Quality Score creates a compounding CTR effect. In paid search, higher CTR improves Quality Score, which lowers CPC, which can allow you to bid more competitively, which can improve position, which drives higher CTR. Campaigns that break above the industry average tend to stay above it once they get there.
Below-average CTR has multiple possible causes:
- Ad copy that doesn’t match the search query intent
- Targeting too broad – impressions going to the wrong audience
- Weak or overly generic call-to-action
- Poor ad rank (positions 4+ where CTR drops sharply)
- Keyword match types pulling in off-topic traffic
A high CTR doesn’t guarantee profitability. The actual measure of campaign health is CPA relative to customer value. A campaign with a 10% CTR but a $300 cost per acquisition might not be viable, while one with a 5% CTR and a $35 CPA runs profitably at scale. Using the ROI Calculator alongside CTR confirms whether the math actually works.
How AI Overviews Are Reshaping the CTR Landscape
The expansion of AI Overviews across Google’s search results is one of the more significant structural changes affecting CTR benchmarks right now, and its impact on both paid and organic results is worth understanding clearly.
Organic CTR when AI Overviews are displayed has been steadily declining, and the ratio of organic CTR with AIO shown compared to without has decreased significantly – indicating that the presence of AI Overviews is having an increasingly suppressive effect on click-through behavior.
According to research from Search Engine Land, paid CTR on queries showing AI Overviews can drop significantly compared to traditional search results. This affects both organic and paid channels, which means if your top-converting keywords are now triggering AI Overviews, you’ll likely see CTR pressure across the board for those terms.
The practical responses that are working in 2026:
- Prioritize commercial, transactional, and comparison queries where users need to visit a source to get what they need – these are less likely to be satisfied by an AI Overview
- Target featured snippets deliberately – at ~42.9% CTR they still outperform standard position 1, and they appear above or in place of AI Overviews for many query types
- Strengthen organic CTR by testing title tags and meta descriptions systematically, since those elements determine whether someone clicks your result when they do see it
- For paid search, test more aggressive ad extensions and structured snippets on keywords where AI Overviews are appearing – these can help ads stand out when the SERP is crowded
Checking how your title tags and descriptions actually render before publishing is worth the extra step. The SERP Snippet Preview tool and Meta Title & Description Checker at QuickMarketingTools make it easy to verify both before a page goes live.
Common Misconceptions About CTR Benchmarks
“My CTR is below average, so my ads are failing.” Not necessarily. CTR below the industry average can mean your targeting is broad and serving impressions to uninterested audiences. Tightening targeting often reduces impressions and temporarily drops the calculated CTR, but improves conversion quality substantially. Always evaluate CTR alongside conversion rate before drawing conclusions.
“Higher CTR always means a better ad.” Sensationalist or misleading copy can drive high CTRs and terrible conversion rates. Someone who clicks expecting one thing and finds another bounces immediately. The best ad copy creates accurate expectations – the person who clicks knowing what they’ll find is worth more than someone who clicks out of curiosity and leaves.
“Display CTRs are too low to be worth running.” Display at 0.46% average CTR looks underwhelming until you account for CPM costs. Reaching 1,000 people on the Google Display Network costs around $2.80 on average. For brand awareness, retargeting, and staying visible during long B2B sales cycles, the economics can work even without high CTR.
“Industry benchmarks apply directly to my account.” They’re reference points, not targets. Your specific business model, price point, geographic market, targeting configuration, and landing page quality all influence where you’ll land relative to the average. Build your own internal benchmarks from historical account data and use industry figures to assess whether you’re in a reasonable range.
Improving CTR: What Actually Moves the Needle
There’s no shortage of generic advice on this topic. What actually produces results in practice:
For paid search: Use ad customizers and dynamic elements to insert specific information at scale – countdown timers for promotions, location insertion for local campaigns, inventory-based messaging for ecommerce. These create relevance that generic copy can’t replicate.
Write calls-to-action that reflect where the user is in their journey. “Compare Plans” performs differently from “Buy Now” or “Book a Free Consultation” – the right CTA depends on the keyword intent, not a blanket preference. The Keyword Intent Checker helps match copy to actual search intent before writing a word.
For email: Segmentation moves CTR more than almost any copy change. A generic list gets generic CTR. Segmenting by purchase history, engagement level, or stated preferences consistently outperforms optimization work on the email itself.
Single, clear CTAs outperform emails with five links. When people aren’t sure what to click, many click nothing. Behavioral triggers – cart abandonment, price drop alerts, onboarding sequences – routinely hit 5-6% CTR because they arrive at moments of demonstrated interest, not scheduled broadcast windows.
For organic search: Test title tags and meta descriptions the same way you’d test ad copy – with a hypothesis, a clear variation, and enough traffic to measure. Small changes in how a title is framed can produce meaningful CTR differences at scale, especially for posts sitting in positions 4-10 where the gap to position 3 is relatively small.
Putting It All Together
CTR benchmarks give you a starting point for knowing whether your campaigns are broadly in range or structurally underperforming. But they matter most when paired with the economics of your actual business.
A 4.5% paid search CTR in B2B services with a $180 CPA and $60,000 average contract value is a very healthy campaign. The same 4.5% CTR in ecommerce with a $28 average order value probably doesn’t survive the math. Use the Break-Even ROAS Calculator to figure out the minimum return your campaigns need before optimizing toward any specific CTR target.
The real question behind every CTR benchmark isn’t “am I above or below average?” It’s “am I generating positive returns, and is there a clear path to improving them?” CTR is one input into that answer – not the answer itself.