A marketer asks this question almost every week, and the honest answer depends entirely on what “engagement rate” is measuring. Someone checking their GA4 dashboard and someone checking an Instagram Reel are looking at two completely different metrics that happen to share a name. This gets confusing fast, and most articles on the topic pick one definition and ignore the other, which leaves half of readers without an answer.
This guide covers both. You’ll get real benchmark numbers for website engagement rate in Google Analytics 4, plus current social media engagement rate benchmarks by platform, so you can figure out where you actually stand instead of guessing.
Quick Answer
For a website (GA4 engagement rate), 50-63% is a reasonable average, and anything above 65% suggests your content is genuinely holding attention. For social media, a good engagement rate is typically 1-3% on Instagram, 2-4% on TikTok, under 1% on Facebook and X, and 2-5% on LinkedIn, though this varies heavily by follower count and industry. There is no single universal “good” number for either metric. What matters more is whether your rate is trending up, and how it compares to your own historical baseline and your specific industry.
Two Different Metrics, One Confusing Name
Before benchmarking anything, it helps to separate what you’re actually measuring.
Website engagement rate (GA4) is the percentage of sessions on your site that Google Analytics classifies as “engaged.” A session counts as engaged if it lasts 10 seconds or longer, includes two or more page views, or triggers a conversion event. It replaced the old bounce rate metric as the default quality signal in Google Analytics 4, and it’s essentially the inverse of bounce rate. If your engagement rate is 58%, your bounce rate is 42%.
Social media engagement rate is a completely different calculation. It typically measures interactions (likes, comments, shares, saves) divided by followers or impressions, expressed as a percentage per post. Platforms, formats, and audience sizes all change what “normal” looks like here.
Because the two metrics measure such different things, this article treats them separately rather than blending them into one benchmark table that would mislead more than it helps.
Good Website Engagement Rate (GA4) Benchmarks
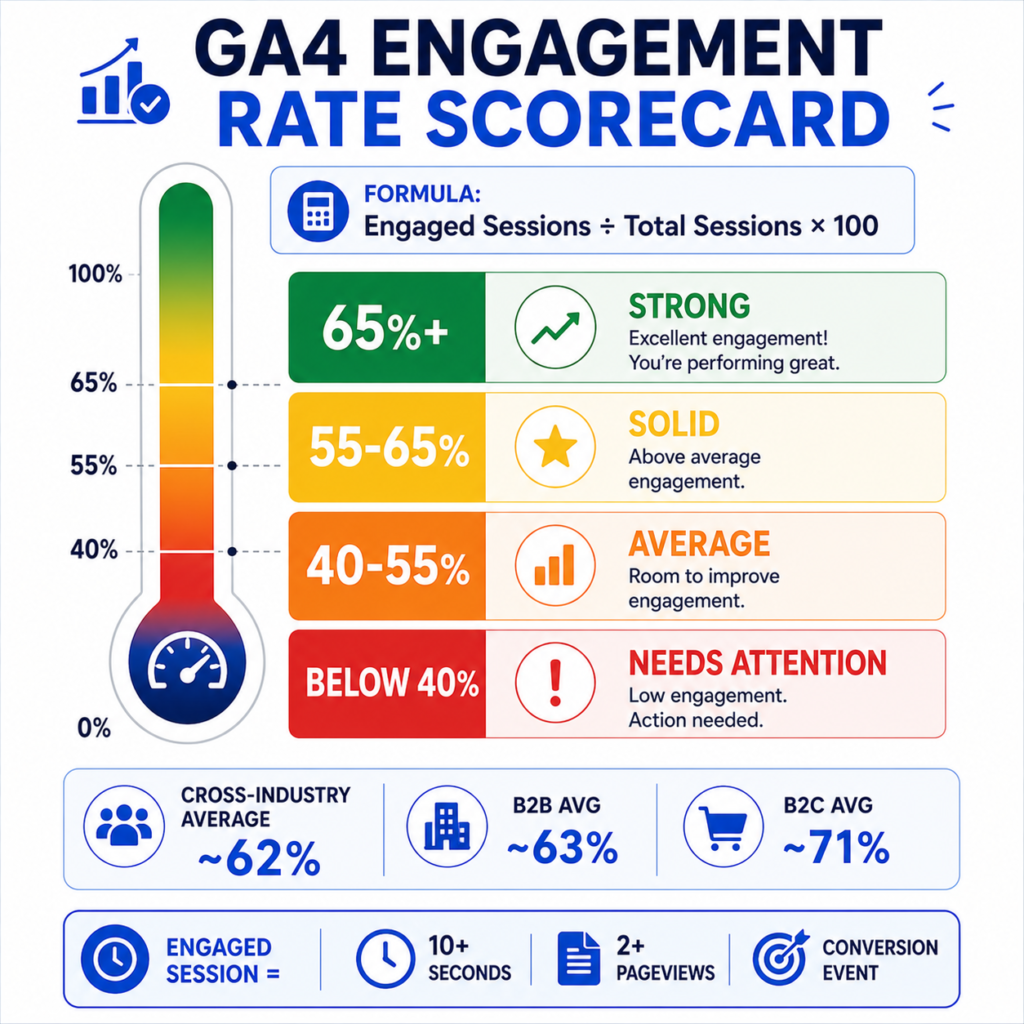
Based on aggregated agency and platform data, here’s how website engagement rate typically breaks down:
| Range | What it usually means |
| Below 40% | Likely a landing page, thin content, or a traffic-quality mismatch |
| 40-55% | Average for most content sites and B2B pages |
| 55-65% | Solid performance, above typical benchmarks |
| 65%+ | Strong engagement, often seen on well-optimized blogs and informational content |
A few data points worth knowing. An analysis of client sites by an analytics agency found the average engagement rate across industries and company types sits around 62%. Separately, one industry study found B2B websites average roughly 63% engagement, while B2C sites run slightly higher at around 71%, which the same source attributes partly to purchase complexity and decision length. Content-heavy sites tend to run their own range too: informational pages like blog posts often land between roughly 45% and 60%, with anything over 50% considered a strong showing for that content type. Arvo Digital + 2
You’ll notice these numbers don’t all agree, and that’s normal. Different agencies pull from different client portfolios, so treat any single benchmark as a directional reference, not gospel. If you want to see exactly how your own site’s engagement rate translates into bounce rate, and vice versa, QuickMarketingTools’ bounce rate calculator makes that conversion quick since the two are mathematical opposites.
Why GA4 Engagement Rate Isn’t Comparable to Old Bounce Rate
If you’re used to Universal Analytics, don’t try to compare your old bounce rate percentage directly to your new GA4 numbers. UA counted a bounce as a single-page session with no other activity. GA4’s definition is broader and counts time on page and conversion events too, so the two metrics were never built the same way. A site that had a 60% bounce rate in UA might show a 55% engagement rate in GA4, and that’s not necessarily an improvement or decline, it’s a different measurement system entirely. If your bounce rate suddenly looks unusual after switching, our piece on why your bounce rate might be high walks through the common causes.
Good Social Media Engagement Rate Benchmarks
Social platforms move fast, and 2026 data shows engagement continuing to compress across most networks compared to a few years ago.
| Platform | Typical engagement rate | Notes |
| TikTok | 2.5-4.3% | Highest average across platforms, though still declining year over year |
| 0.3-1% | Reels and Carousels typically outperform static images | |
| 0.13-0.17% | Lowest engagement of the major platforms | |
| X (Twitter) | 0.10-0.12% | Continues a multi-year decline |
| 2-5% | Varies widely by post type and account size |
Current data illustrates why picking a single “good” number is difficult. One 2026 benchmark report puts TikTok’s engagement rate by followers at an average of 2.60%, a 10% year-over-year decrease, while Facebook averaged 0.15% engagement. A separate industry-wide benchmark guide reports Instagram closer to 0.48% based on Socialinsider’s analysis of 70 million posts, versus 0.15% for Facebook and 0.12% for X. Meanwhile, a platform-wide Instagram benchmark from RivalIQ places the median Instagram engagement rate across all industries at 0.36%, and notes that number shifts meaningfully depending on industry, content format, and audience size. Socialinsider + 2
That’s a real spread on the same platform in the same year, depending purely on methodology and sample. The practical takeaway: don’t chase a number from a single report. Look at the range across multiple sources, then compare yourself against accounts of a similar size in your own niche.
Follower Count Changes Everything
This is the part most engagement rate advice skips. A dental practice with 900 Instagram followers and a national retail brand with 2.3 million followers are not playing the same game. Smaller, more concentrated audiences consistently out-engage large, diffuse ones. As one benchmark analysis put it plainly, beating a large brand’s low engagement rate with a small, tightly connected following isn’t really an achievement, it’s the expected outcome given how the math works. If you manage a small business account, benchmark against accounts your size, not against national brands with millions of followers.
A Real-World Example: Comparing Two Businesses
Say you’re running marketing for a mid-size SaaS company. Your website pulls 15,000 sessions a month, and GA4 shows 9,200 of those as engaged sessions. That’s a 61.3% engagement rate, comfortably in the “solid” range and above the roughly 62% cross-industry average.
Now say your company’s Instagram account has 8,000 followers and your last ten posts averaged 95 likes, 12 comments, and 8 saves per post, or about 115 interactions on 8,000 followers. That’s a 1.4% engagement rate, which sits above the platform-wide Instagram average of roughly 0.3-0.5% but below what a well-run niche account with a smaller, more loyal following might achieve.
Two different metrics, two different “good” thresholds, same business. This is exactly why treating engagement rate as one universal number leads teams astray in reporting meetings.
What Actually Drives a Higher Website Engagement Rate
A few factors consistently show up across studies:
- Traffic source quality. Organic search visitors tend to engage significantly more than paid or social traffic, since they arrived with active search intent rather than a passive scroll interruption.
- Content match to intent. A page that answers exactly what someone searched for holds attention longer than a page that’s technically related but misses the specific question.
- Page speed and mobile experience. Slow-loading pages lose visitors before the 10-second engagement threshold is even reached.
- Internal linking and next steps. Pages with a clear next click tend to generate the two-plus pageviews that count as engagement, so internal linking strategy has a real, measurable effect on this metric.
If you want a broader sense of how engagement interacts with related metrics like average session duration and pages per session, those two pieces cover the supporting metrics that usually move together with engagement rate.
Common Mistakes When Judging Your Engagement Rate
Comparing across traffic sources without segmenting. A blended 55% engagement rate might hide a paid campaign performing at 30% and organic search performing at 75%. Always check the Traffic Acquisition report segmented by channel before drawing conclusions.
Chasing an industry average instead of your own baseline. Cross-industry benchmarks are useful starting points, not targets. Your own historical trend line matters more, since it accounts for your specific audience, content type, and traffic mix.
Treating a single low-traffic month as a trend. Small sample sizes swing engagement rate around a lot. A landing page with 40 sessions can show wild engagement rate fluctuations from week to week purely due to volume, not actual performance change.
Ignoring the relationship between engagement rate and conversion rate. A high engagement rate doesn’t automatically mean strong business results. Someone can spend three minutes on a page and still not convert. Pairing engagement data with your conversion rate by industry benchmarks gives a fuller picture of whether attention is actually translating into outcomes.
When a “Good” Engagement Rate Still Isn’t Good Enough
There’s a scenario worth flagging directly. A B2B software company can post a 68% GA4 engagement rate, well above average, while still missing revenue targets because visitors are engaging with the wrong pages, like a blog post that ranks well but never leads to a demo request. Engagement rate tells you people are sticking around. It doesn’t tell you they’re moving toward a purchase decision. If your engagement numbers look healthy but pipeline doesn’t, the fix usually isn’t more content, it’s better internal linking toward conversion pages and clearer calls to action on the pages already earning attention.
How to Improve Engagement Rate Without Guessing
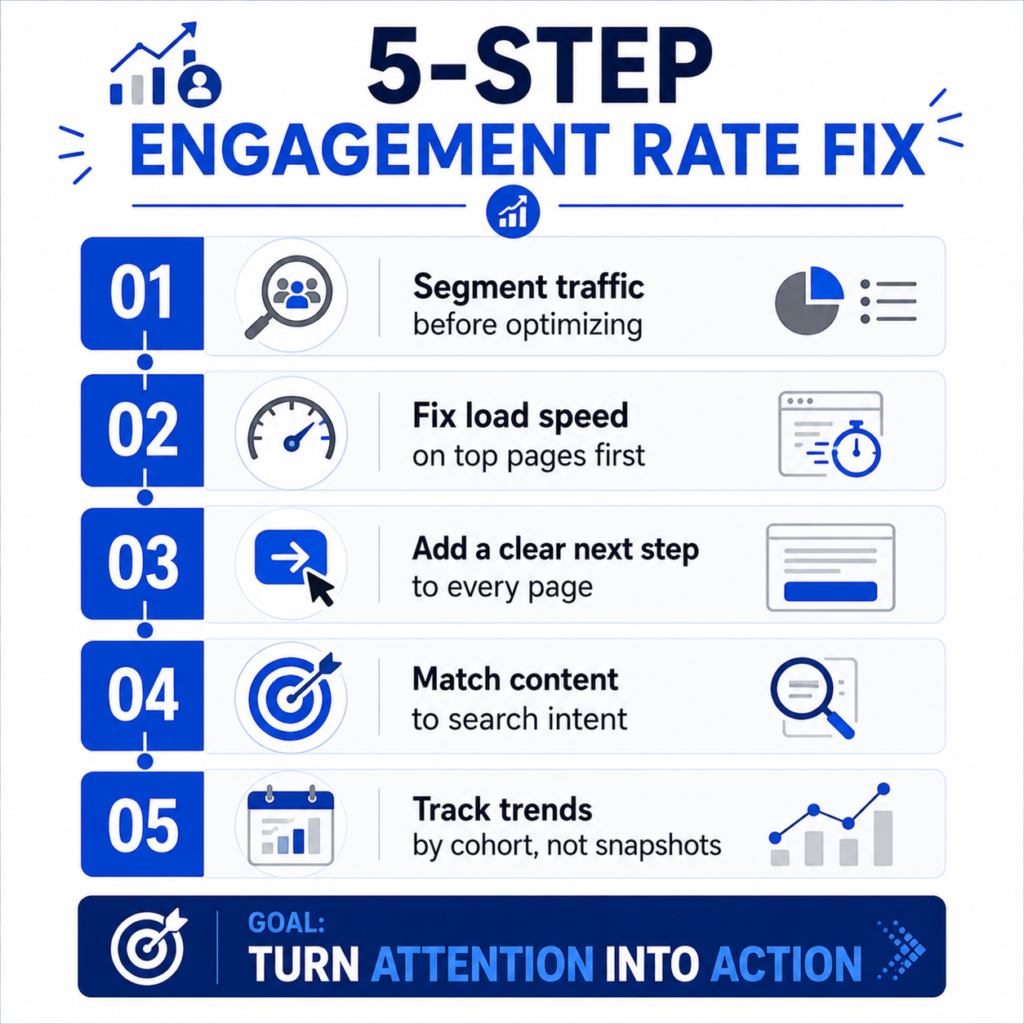
- Segment before you optimize. Find which traffic sources and pages are dragging your average down rather than trying to lift the whole site at once.
- Fix load speed on your worst-performing pages first. Even small speed improvements on high-traffic pages compound across thousands of sessions.
- Add a clear next step to every page. A related-article link, a tool recommendation, or a simple CTA increases the odds a visitor crosses the two-pageview threshold.
- Match content depth to search intent. Thin pages targeting broad, high-intent queries tend to bounce fast. Reviewing your keyword intent before publishing helps avoid this mismatch.
- Track by cohort over time, not by isolated snapshots. A month-over-month view in a marketing KPI dashboard shows real trend direction instead of noise.
Frequently Asked Questions
Is a 50% engagement rate good in GA4?
It’s roughly average for most sites. It’s not weak, but it’s also not standout. Anything consistently above 60% is generally considered strong.
Why is my engagement rate high but my conversion rate low?
This usually means visitors are interested enough to stay or browse multiple pages, but the content or offer isn’t compelling them to take the next step. Check whether your calls to action match what engaged visitors are actually looking for.
Does engagement rate replace bounce rate in GA4?
Not exactly, GA4 does still report bounce rate, but engagement rate is the platform’s default framing, and the two are mathematical opposites. If one goes up, the other goes down by the same amount.
What’s a good engagement rate for a small Instagram account?
Small, niche accounts often see 3-6% engagement, well above brand-level averages, because their audience is smaller and more personally connected. Compare yourself to accounts of similar follower size, not to national brands.