Every marketer eventually gets asked some version of the same question: “is this number good?” A client sees a 2.1% CTR and panics. A founder sees a 3.5x ROAS and wants to know if that’s worth celebrating. The honest answer is always “it depends on your industry” – but that answer is useless without the actual data behind it.
This guide pulls together the most current benchmark data available for the four metrics that come up in almost every performance review: click-through rate, cost per click, conversion rate, and return on ad spend. Where the data is solid and industry-segmented, you’ll see exact figures. Where it isn’t (ROAS reporting is notoriously inconsistent across platforms and agencies), you’ll see ranges with the reasoning behind them, not a fake single number dressed up to look precise.
Average Marketing Benchmarks in 2026
For Google and Microsoft search ads, LocaliQ/WordStream’s 2026 benchmark report puts the cross-industry averages at a 6.64% click-through rate, a $5.42 cost per click, an 8.18% conversion rate, and a $66.69 cost per lead across the campaigns it analyzed. ROAS is harder to benchmark responsibly because it varies by channel, attribution window, margin structure, and whether revenue or profit is being measured.
None of these numbers mean much in isolation. A SaaS company and a local HVAC contractor could both hit a 6% CTR and be having completely different quarters. The rest of this article breaks the averages down by industry so you have something closer to an apples-to-apples comparison.
Why Industry Context Changes Everything
A cost per click of $8 looks alarming next to a $2 average – until you realize it’s a family law attorney whose average case is worth $6,000, compared to a print-on-demand t-shirt shop selling $22 items. The dollar figure means nothing without knowing what happens after the click.
This is the part benchmark tables never show you: the metric only matters in relation to what a conversion is worth to your specific business. That’s why a marketing benchmark report is a starting point for a conversation, not a scorecard. If you want to sanity-check your own numbers before comparing them to any table below, QuickMarketingTools’ ROAS calculator and break-even ROAS calculator are useful for translating “good” into a number that’s actually good for your margins.
Click-Through Rate (CTR) Benchmarks by Industry
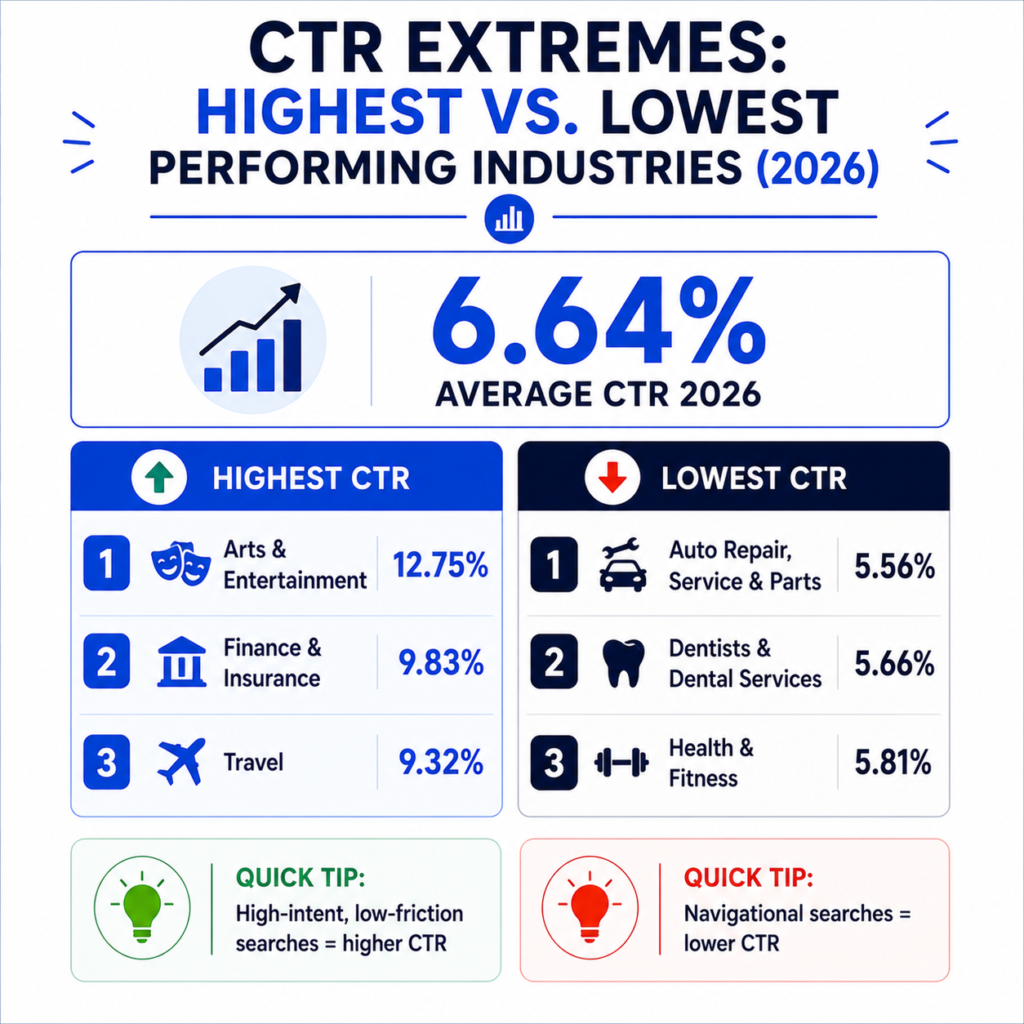
CTR tells you whether your ad copy, targeting, and offer are relevant enough to earn a click before anything downstream even matters. WordStream’s 2026 report, based on over 13,000 US search campaigns running April 2025 through March 2026, puts the cross-industry average at 6.64%.
| Industry | Average CTR |
| Arts & Entertainment | 12.75% |
| Finance & Insurance | 9.83% |
| Travel | 9.32% |
| Sports & Recreation | 8.75% |
| Automotive – For Sale | 8.28% |
| Shopping, Collectibles & Gifts | 8.28% |
| Real Estate | 7.61% |
| Education & Instruction | 7.56% |
| Personal Services | 7.16% |
| Beauty & Personal Care | 6.75% |
| Restaurants & Food | 6.83% |
| Physicians & Surgeons | 6.61% |
| Apparel / Fashion & Jewelry | 6.64% |
| Furniture | 6.57% |
| Industrial & Commercial | 6.57% |
| Home & Home Improvement | 6.47% |
| Business Services | 6.10% |
| Career & Employment | 5.88% |
| Attorneys & Legal Services | 5.87% |
| Dentists & Dental Services | 5.66% |
| Health & Fitness | 5.81% |
| Automotive – Repair, Service & Parts | 5.56% |
A couple of patterns worth noticing. Arts & Entertainment sits far above everyone else, which makes sense – people searching for concert tickets or streaming content already have high intent and low decision friction. Automotive repair sits at the bottom, likely because those searches are often navigational (“Midas near me”) rather than comparison shopping across multiple ad results.
If your CTR is below your industry line, before touching your bids, check the actual ad copy. Run your top three headlines through the meta title & description checker – the same relevance and clarity principles that improve organic click-through rates apply almost identically to paid search headlines.
Cost Per Click (CPC) Benchmarks by Industry
CPC tells you what you’re paying for that click – and it’s driven heavily by auction competition and the lifetime value of a typical customer in that vertical. The 2026 cross-industry average is $5.42, more than double the $2.32 average WordStream recorded when it started tracking this in 2016.
| Industry | Average CPC |
| Attorneys & Legal Services | $9.87 |
| Home & Home Improvement | $8.33 |
| Dentists & Dental Services | $8.00 |
| Personal Services | $7.17 |
| Health & Fitness | $6.17 |
| Business Services | $5.87 |
| Industrial & Commercial | $5.87 |
| Career & Employment | $5.81 |
| Physicians & Surgeons | $4.76 |
| Education & Instruction | $4.81 |
| Beauty & Personal Care | $4.62 |
| Apparel / Fashion & Jewelry | $4.44 |
| Automotive – Repair, Service & Parts | $4.35 |
| Shopping, Collectibles & Gifts | $4.14 |
| Animals & Pets | $4.06 |
| Furniture | $3.97 |
| Finance & Insurance | $3.39 |
| Real Estate | $3.22 |
| Sports & Recreation | $2.77 |
| Automotive – For Sale | $2.27 |
| Travel | $2.14 |
| Restaurants & Food | $2.05 |
| Arts & Entertainment | $1.63 |
Notice that legal services top both the CPC table and, as you’ll see below, the ROAS table. That’s not a contradiction – it’s the whole point of using CPC and downstream value together instead of judging cost in a vacuum. A $9.87 click that closes into a $5,000 retainer is a very different proposition than a $9.87 click on a $40 product.
If your CPCs have crept up faster than your industry’s typical year-over-year movement, it’s worth auditing your account structure rather than assuming the whole market got more expensive. Overlapping keywords, weak negative keyword lists, or stale ad groups can inflate CPC regardless of what your competitors are doing.
Conversion Rate Benchmarks by Industry
Conversion rate is where clicks turn into something that actually matters to the business – a lead, a sale, a booked appointment. The overall 2026 average across search campaigns is 8.18%, up from 7.52% in 2025.
| Industry | Average Conversion Rate |
| Animals & Pets | 16.22% |
| Automotive – Repair, Service & Parts | 15.51% |
| Education & Instruction | 13.14% |
| Physicians & Surgeons | 12.43% |
| Personal Services | 12.34% |
| Dentists & Dental Services | 10.67% |
| Beauty & Personal Care | 10.35% |
| Industrial & Commercial | 8.20% |
| Home & Home Improvement | 8.05% |
| Restaurants & Food | 8.05% |
| Sports & Recreation | 7.69% |
| Health & Fitness | 6.94% |
| Automotive – For Sale | 6.01% |
| Arts & Entertainment | 5.91% |
| Travel | 5.83% |
| Attorneys & Legal Services | 5.55% |
| Apparel / Fashion & Jewelry | 4.50% |
| Business Services | 4.85% |
| Shopping, Collectibles & Gifts | 4.01% |
| Real Estate | 3.70% |
| Career & Employment | 3.05% |
| Furniture | 2.99% |
| Finance & Insurance | 2.64% |
The gap between the top and bottom of this table is enormous – Animals & Pets converts at over six times the rate of Finance & Insurance. That’s largely a function of purchase complexity. Buying pet food is a low-friction, low-risk decision. Comparing insurance quotes or loan terms involves multiple pages, forms, and often a phone call, so more people drop off before completing a tracked conversion event.
If your conversion rate looks weak against your industry line, resist the urge to blame your ads first. In most audits, the leak is on the landing page – slow load times, a form asking for too much too early, or a mismatch between what the ad promised and what the page delivers. A quick readability score check on your landing page copy can flag whether the page is actually easy to act on, not just easy to read.
Cost Per Lead by Industry
Cost per lead ties CTR, CPC, and conversion rate together into the number most business owners actually care about. The 2026 average across all industries is $66.69 – notably, this is the first year since before 2020 that this figure has gone down rather than up.
| Industry | Average CPL |
| Arts & Entertainment | $26.84 |
| Automotive – Repair, Service & Parts | $29.96 |
| Restaurants & Food | $30.57 |
| Animals & Pets | $31.50 |
| Beauty & Personal Care | $39.25 |
| Physicians & Surgeons | $40.04 |
| Automotive – For Sale | $44.26 |
| Sports & Recreation | $44.26 |
| Travel | $44.70 |
| Personal Services | $54.60 |
| Career & Employment | $67.36 |
| Health & Fitness | $67.36 |
| Dentists & Dental Services | $72.97 |
| Finance & Insurance | $74.44 |
| Industrial & Commercial | $75.19 |
| Education & Instruction | $77.48 |
| Home & Home Improvement | $90.92 |
| Business Services | $93.69 |
| Real Estate | $102.51 |
| Furniture | $106.70 |
| Apparel / Fashion & Jewelry | $97.51 |
| Attorneys & Legal Services | $131.63 |
Cost per lead only becomes useful once you connect it to your close rate and average deal value. A $131 cost per lead sounds brutal for a law firm until you realize a single signed case can be worth tens of thousands of dollars – which is exactly why legal stays at the top of the CPL table and near the top of the ROAS table at the same time. If you’re trying to figure out what you can actually afford to pay per lead, run your numbers through the CAC calculator alongside your LTV calculator results – the ratio between the two tells you far more than the raw CPL figure does.
ROAS Benchmarks by Industry
ROAS is the metric where you’ll see the most disagreement between reports, and it’s worth understanding why before you take any single number as gospel. Unlike CTR or CPC, which come from platform-level auction data, ROAS depends heavily on attribution windows, whether it’s calculated on revenue or profit, and whether it’s blended across channels or reported per-platform. A “4x ROAS” on Meta with a 7-day click attribution window is not the same number as a “4x ROAS” reported on last-touch Google Analytics data.
With that caveat in place, here is a directional planning table, not an official cross-platform benchmark report:
| Industry / Channel | Typical ROAS Range |
| Legal Services | 6:1 to 8:1 |
| Travel & Hospitality | 5:1 to 6.5:1 |
| B2B & Technology | 4:1 to 5:1 |
| Consumer Packaged Goods | 4:1 to 5:1 |
| Apparel & Beauty | 3.5:1 to 4.3:1 |
| General Ecommerce (blended) | 2.5:1 to 4:1 |
| Google Shopping specifically | 3:1 to 5:1 |
| Healthcare & Wellness | 2.3:1 to 3.5:1 |
| Mobile App User Acquisition | Below 1:1 in week one, improving over 30-90 days |
The pattern to use carefully: industries with high-value, high-consideration purchases can tolerate a different paid-media model than low-margin, high-volume ecommerce. A higher reported ROAS does not automatically mean better marketing; it may simply reflect larger transaction values, longer attribution windows, or a different conversion definition.
The number worth remembering is your own break-even ROAS. If a campaign sits around 2:1, it may be profitable for a high-margin business and unprofitable for a low-margin one. That’s exactly what the break-even ROAS calculator is built to answer, since a “good” ROAS is really a margin question wearing a marketing metric’s clothes.
A Realistic Scenario: Reading Benchmarks Correctly
Say you run marketing for a mid-size ecommerce brand selling home goods, and last month’s Google Ads account posted a 5.9% CTR, a $4.20 CPC, a 3.4% conversion rate, and a 2.6:1 ROAS.
Held up against the Home & Home Improvement row above (6.47% CTR, $8.33 CPC), your CTR is close to average but your CPC is nearly half the benchmark – which sounds like a win. Except your conversion rate is well below the 8.05% Home & Home Improvement average, and a 2.6:1 ROAS is on the low end of the general ecommerce range.
Read individually, each metric tells a different, contradictory story. Read together, the diagnosis is clearer: you’re winning cheap traffic (good CPC) that isn’t landing on a page built to close (weak conversion rate), and the ROAS problem downstream is a symptom of that, not a separate issue. The fix here almost never starts with the ad platform – it starts with the landing page, the offer clarity, and possibly the audience match. This is the actual value of a benchmark table: not a single grade, but a way to triangulate where in the funnel the leak is happening.
Common Mistakes When Using Marketing Benchmarks
Comparing blended averages to a single campaign. An industry average includes brand and non-brand campaigns, mobile and desktop, every geography in the dataset. Your one campaign targeting a single city will naturally swing further from the mean in either direction.
Treating “average” as “good.” WordStream and most benchmark providers report medians specifically to reduce the influence of outliers, but even a median is just the middle of the pack, not a target. Beating your industry average by a small margin still leaves you exactly where most of your competitors are.
Ignoring seasonality. Retail and gift categories swing hard in Q4. Comparing a November conversion rate to an annual industry average will make almost any retailer look artificially strong or weak depending on timing.
Chasing CTR at the expense of conversion rate. It’s possible to write clickbait-style ad copy that inflates CTR while attracting the wrong searchers who bounce immediately. A lower CTR from tightly matched, high-intent copy is often the better business outcome even though it looks worse on a scorecard.
Using ROAS without a break-even number. As shown above, a 3:1 ROAS can be excellent or unprofitable depending entirely on your margins. Never take a ROAS benchmark at face value without running your own numbers first.
When Benchmarks Don’t Apply to You
Benchmarks are built from aggregated Google and Microsoft Ads data, which means they’re most reliable for search campaigns with a reasonable volume of traffic. They get less reliable, and sometimes actively misleading, in a few common situations:
- Brand-new campaigns still in the learning phase, where the algorithm hasn’t optimized delivery yet
- Very low-volume accounts, where a handful of conversions can swing your rate by several percentage points
- Highly localized or niche B2B offers that don’t map cleanly onto broad industry categories
- Multi-touch B2B sales cycles, where a single click-to-conversion metric ignores the weeks or months between first touch and closed deal
In any of these cases, treat the tables above as general context rather than a direct scorecard, and lean more heavily on your own historical trend line – is this month better or worse than your last six months, not just better or worse than a national average.
Turning Benchmarks Into Action
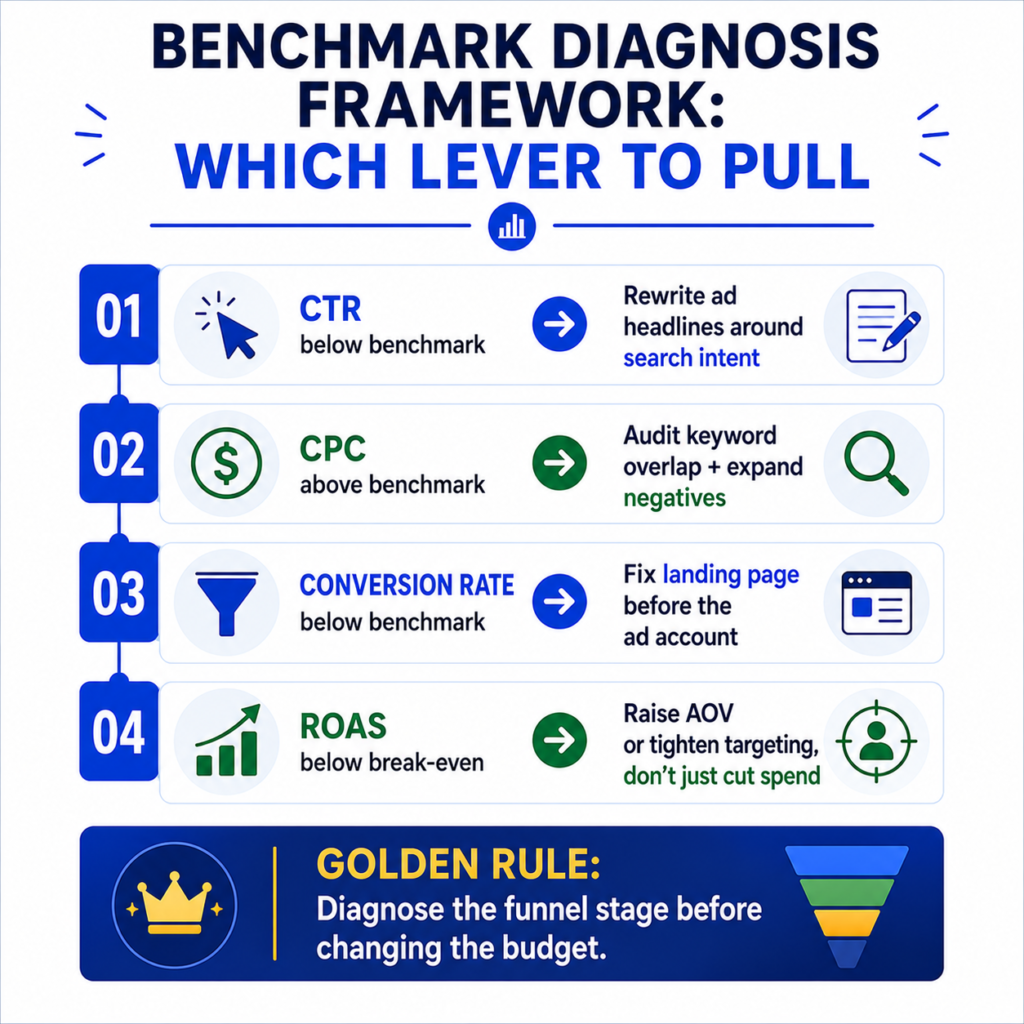
Knowing the numbers is the easy part. Acting on them usually comes down to a short list of levers:
- If CTR is below benchmark: rewrite ad headlines around the actual search intent, and test whether Responsive Search Ads assets are pulling in your strongest messaging.
- If CPC is above benchmark: audit for keyword overlap between ad groups, tighten match types, and expand negative keyword lists before assuming the whole market got more expensive.
- If conversion rate is below benchmark: start with the landing page before the ad account – check load speed, form length, and message match between ad copy and page headline.
- If ROAS is below your break-even point: the fix is rarely “spend less.” It’s usually improving average order value, tightening audience targeting, or renegotiating margin somewhere upstream.
For teams tracking all of this across multiple campaigns, the marketing KPI dashboard is a straightforward way to keep CTR, CPC, conversion rate, and ROAS in one place instead of jumping between platform reports every time a client or stakeholder asks how things are going.
Frequently Asked Questions
What is a good marketing benchmark to aim for?
There isn’t one universal number – it depends on your industry, channel, and business model. A 5% conversion rate is strong for finance and weak for pet products. Always compare against your specific vertical, not the blended cross-industry average.
How often do marketing benchmarks change?
Search advertising benchmarks are typically updated annually by providers like WordStream, though costs and competition can shift meaningfully within a single year, especially around major platform algorithm changes or economic events.
Why is my CPC higher than the industry average?
Higher CPC usually comes down to keyword competition, Quality Score, or account structure issues like overlapping keywords bidding against each other. It isn’t automatically a problem if your conversion rate and downstream value justify the cost.
Is a 2:1 ROAS good or bad?
It depends entirely on your margins. For a business with 60% gross margin, a 2:1 ROAS can be profitable. For a business with 20% margin, it likely isn’t. Calculate your break-even ROAS before judging any ratio in isolation.
Do these benchmarks apply to Facebook and Instagram ads too?
Not directly. The CTR, CPC, and conversion rate figures in this article are from search advertising (Google and Microsoft Ads). Social platforms tend to run lower CTR and different conversion patterns since intent is lower at the moment someone sees the ad.
Sources and methodology
This page combines benchmark families that do not all come from the same dataset. Search-advertising CTR, CPC, conversion-rate, and CPL figures are based primarily on LocaliQ/WordStream’s 2026 search advertising benchmark report. ROAS ranges are directional interpretation and should not be treated as a single official 2026 industry table unless the underlying source, platform, and calculation method match your campaign. Compare each metric only with similar channels, geography, attribution windows, and conversion definitions.

1 thought on “Marketing Benchmarks by Industry: CTR, CPC, ROAS, Conversion Rate”
Comments are closed.