Every media buyer eventually asks the same question during a budget review: is this CPC actually reasonable, or are we overpaying? The honest answer is that “reasonable” depends entirely on which industry you’re in. A $6 cost per click would be a disaster for an ecommerce store selling $25 candles, but it’s a bargain for a personal injury law firm where one signed client is worth $40,000. This guide breaks down what advertisers are actually paying per click across major industries in 2026, why the gap between the cheapest and most expensive verticals has widened, and how to use these numbers without falling into the trap of chasing an average that has nothing to do with your business.
Quick Answer: What’s the Average CPC in 2026?
According to the 2026 Search Advertising Benchmarks report from WordStream by LocaliQ, one of the longest-running datasets in the PPC industry, the cross-industry average CPC for search advertising sits at $5.42. That’s more than double what advertisers paid a decade ago ($2.32 in 2016), and it reflects a market where competition for the same auctions has only intensified.
But that single number is close to useless on its own. Attorneys and Legal Services average close to $9.87 per click, while Arts and Entertainment advertisers pay around $1.63. That’s a six-fold difference sitting inside one “average.” If you manage a Google Ads account, the number that matters is your industry’s number, not the blended one.
You’ll also notice that different tracking firms report different averages – some show $2.96, others $4.22, others $5.26. That’s not a contradiction; it comes down to methodology. Some reports pull from Microsoft Ads too, some only track Search (not Display or Shopping), and sample sizes vary by tens of thousands of accounts. Treat every benchmark as a directional guide, not a precise industry law.
Average CPC by Industry: 2026 Benchmark Table
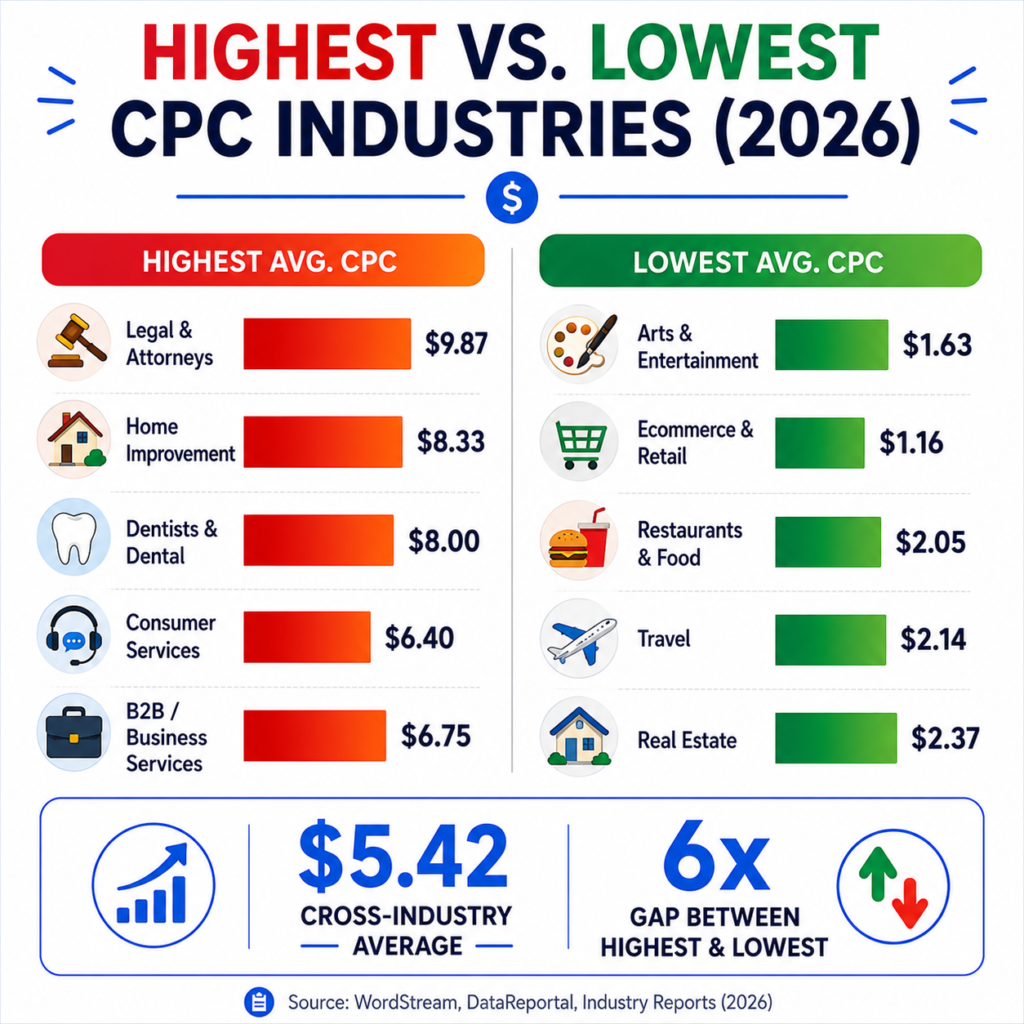
Below is a consolidated view based primarily on WordStream/LocaliQ’s 2026 dataset, cross-referenced against other 2026 industry trackers for context. Where sources diverge meaningfully, both figures are noted.
| Industry | Avg. CPC (Search) | Notes |
| Attorneys & Legal Services | $8.58 – $9.87 | Highest CPC of any tracked vertical; driven by case values often exceeding $40,000-$50,000 |
| Home & Home Improvement | $7.85 – $8.33 | Urgent, high-ticket local searches (roofing, HVAC, remodeling) keep bids aggressive |
| Dentists & Dental Services | $8.00 | High patient lifetime value and limited local supply of providers |
| Consumer/Personal Services | $6.40 | Includes home services, salons, repair – jumped 23%+ YoY |
| Business Services / B2B | $5.58 – $6.75 | Long sales cycles justify high bids for qualified leads |
| Industrial & Commercial | $5.70 | Niche keyword sets with low search volume and high intent |
| Technology / SaaS | $3.80 | Lower CTR (B2B buying behavior) but strong downstream conversion value |
| Health & Fitness | $4.50 (est.) | Rose roughly 23% YoY as gyms and wellness brands scaled paid search |
| Real Estate | $2.37 – $2.53 | Relatively low CPC but often paired with weaker conversion rates |
| Retail & Shopping / Ecommerce | $1.16 – $2.69 | Lowest CPCs in the market; high volume, thin margins |
| Travel | $2.14 | Recovered from pandemic-era volatility, now stable |
| Restaurants & Food | $2.05 | High local search volume keeps CPC low despite competition |
| Arts & Entertainment | $1.63 | Consistently the lowest CPC industry tracked |
A few numbers worth sitting with: real estate CPC jumped 27.27% year-over-year, the largest increase of any industry in the WordStream 2026 report, while personal services and health & fitness both rose roughly 23%. On the other end, education and instruction saw the steepest drop, down nearly 23%, followed by beauty and personal care, down almost 19%. CPC by industry isn’t static – it moves with seasonal demand, algorithm shifts, and how many new advertisers pile into a category.
Why CPC Varies So Much Between Industries
CPC isn’t set by Google in a vacuum. It comes out of a real-time auction where advertisers bid against each other for the same audience, and a few structural factors decide who ends up paying more.
Customer lifetime value drives the ceiling. A law firm can justify a $9 click because one case might be worth tens of thousands of dollars. An ecommerce brand selling a $30 product simply can’t bid that high and stay profitable, so the market settles at a lower price for that keyword set.
Quality Score compresses or inflates cost. Google explicitly rewards ads and landing pages that match search intent well with lower CPCs and better ad positions. Improving Quality Score from a 5 to an 8 can cut CPC by roughly 37%, according to Google’s own Ads documentation. Two advertisers bidding on the identical keyword can pay meaningfully different amounts purely based on relevance and click-through rate.
Low CTR industries tend to have the highest CPC. This shows up consistently across 2026 data – legal, insurance, and medical verticals post some of the lowest CTRs and the highest CPCs at the same time. It’s not coincidental. Weak CTR drags down Quality Score, and a weaker Quality Score pushes the price of every click higher. If your CTR trails your industry benchmark, that’s very likely showing up in your CPC too – it’s worth running your numbers through a CTR calculator to see where you actually stand before assuming your bids are the problem.
Search volume and competition intensity matter. Categories like ecommerce and travel have enormous search volume spread across countless retailers, which keeps individual keyword competition – and therefore CPC – relatively diffuse. Legal and home services have far fewer advertisers chasing far fewer, far more valuable searches in any given city, which concentrates competition and drives bids up.
What’s Pushing CPC Higher Across the Board in 2026
A few platform-level shifts can make click costs feel harder to control, but the often-cited 87% figure should be read as a conversion-rate trend, not a CPC trend. LocaliQ/WordStream’s 2026 benchmark report uses that figure for conversion-rate increases across industries. CPC still varies widely by category, auction pressure, geography, and query intent, so review cost-per-click and conversion-rate trends separately before drawing conclusions.
- AI Overviews are eating organic clicks. As Google’s AI-generated answers occupy more of the search results page, organic click share has dropped for many query types, pushing businesses that previously relied on SEO into paid search to maintain visibility.
- Performance Max is reshaping auction dynamics. Automated campaign types now access more ad inventory than manual campaigns could reach, which increases the number of advertisers competing for the same impressions.
- AI-assisted bidding is now the default, not the exception. Smart Bidding and automated strategies now account for the large majority of Google Ads spend, and while they tend to improve efficiency for individual accounts, the aggregate effect across the platform is more competitive, faster-moving auctions.
None of this means paid search stopped working. Conversion rates actually improved for a large share of industries in 2026 even as CPC rose, which suggests the users clicking on ads are still qualified buyers – the clicks just cost more to earn.
How to Actually Use These Benchmarks
Benchmarks are only useful if you resist the urge to treat them as a scoreboard. Here’s a more practical way to apply them.
1. Anchor to your industry number, not the blended average. If you run a dental practice paying $7.50 per click, comparing yourself to the $5.42 cross-industry figure will make you think you’re overpaying when you’re actually right in line with your category.
2. Work backward from what a click is worth to you, not what it “should” cost. Take your average order value or average deal size, multiply it by your typical close rate, and you’ll get a realistic ceiling for what you can afford to pay per click and still turn a profit. This is the same logic behind a solid ROAS calculation – the target isn’t “low CPC,” it’s profitable CPC.
3. Watch the trend line, not just the snapshot. A CPC that’s 10% above benchmark but trending down month over month is a healthier signal than one that’s at benchmark but climbing fast with no explanation.
4. Compare CPC against CPA, not in isolation. A $9 CPC in legal services sounds alarming until you see the CPA and lead-to-client conversion rate behind it. If you haven’t separated these two metrics clearly, our piece on CTR vs CPC walks through how they interact and where each one tells you something different.
5. Segment by device and network before panicking. Mobile CPCs typically run 20-30% lower than desktop, and Display network CPC is often 85-90% cheaper than Search. If your blended account CPC looks high, break it down by network and device first – you might be looking at a Search-heavy account that’s actually performing fine.
A Quick Example: Local Home Services Business
Say you run a mid-sized HVAC company in a mid-tier metro area. Your industry benchmark CPC sits around $8. At a $3,000 monthly Search budget, that’s roughly 375 clicks. If your landing page converts at a modest 8% (in line with home services averages), you’re looking at about 30 leads a month. If one in four leads books a service call worth an average $450 ticket, that’s 7-8 jobs, or roughly $3,300 in revenue against $3,000 in ad spend before accounting for close rate improvements or repeat business.
The math doesn’t look great at first glance – but home services businesses rarely stop at one visit. Once you factor in maintenance plans, seasonal tune-ups, and referrals, the real ROAS tends to be considerably higher than what the first-touch numbers suggest. This is exactly why looking at CPC alone, without mapping it through to lifetime value, leads people to abandon channels that are actually working. Running the same scenario through a break-even ROAS calculator before making a budget decision usually paints a clearer picture than staring at CPC in isolation.
Common Mistakes When Benchmarking CPC
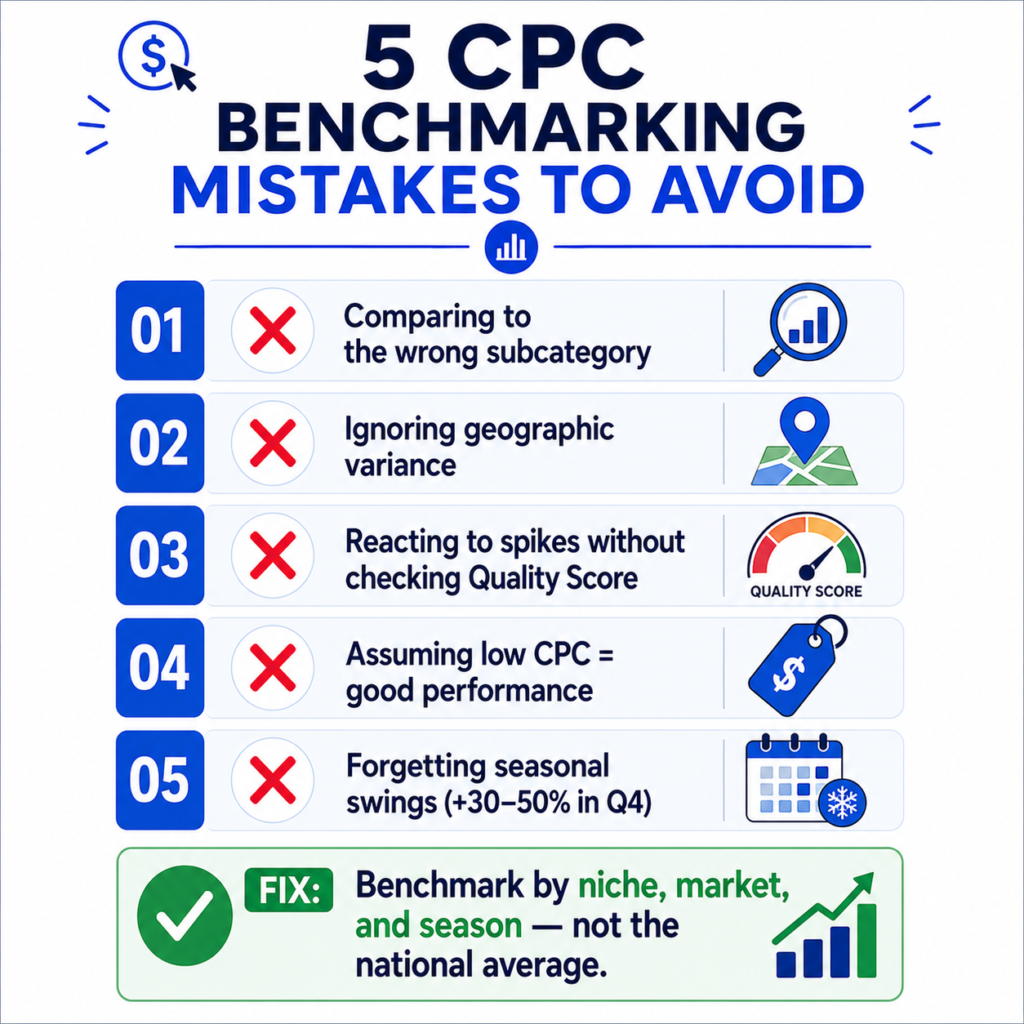
Comparing your account to the wrong subcategory. “Legal” isn’t one category – personal injury, family law, and immigration law have very different CPC profiles under that same umbrella. Get as granular as the data allows.
Ignoring geographic variance. National benchmarks blend rural and metro data together. A dentist in a dense metro market with six competing practices within two miles will see a very different CPC than one in a small town with no local competitors on Google Ads at all.
Reacting to CPC spikes without checking Quality Score first. A sudden jump in CPC is often a symptom, not the root cause. Before adjusting bids, check whether ad relevance or landing page experience quietly dropped.
Treating a low CPC as automatically good. A cheap click that never converts is more expensive than an expensive click that closes. This is where pairing CPC data with a CPA calculator matters more than the raw cost per click ever will.
Forgetting seasonality. CPCs can climb 30-50% during Q4 and around major shopping events as competition for the same inventory intensifies. If you’re benchmarking a November campaign against an annual average, you’ll draw the wrong conclusion.
CPC vs. Other Metrics: Why It’s Rarely the Full Picture
CPC tells you what you’re paying, not what you’re getting. Two accounts with identical CPCs can have wildly different outcomes depending on conversion rate, average order value, and how long customers stick around. If you’re trying to decide which metric actually deserves your attention this month, it usually depends on where the account is underperforming – a high CPC with a strong conversion rate is a very different problem than a low CPC with nobody converting. Our guide on what counts as a good conversion rate by industry is a useful companion to this one, since CPC and conversion rate together are what actually determine whether an account is profitable.
It’s also worth checking your CTR against your industry’s benchmark, since the two metrics move together more often than advertisers expect. If you’ve been asking whether your click-through rate is dragging your account down, the average CTR by industry breakdown pairs naturally with the CPC data here.
If you’re setting a Google Ads budget for the first time or resetting one after a slow quarter, running your numbers through a few calculators before you commit spend tends to save more money than any single bid adjustment. The marketing KPI dashboard and marketing budget planner on QuickMarketingTools are built for exactly this kind of pre-campaign math, and they’re free to use on every plan.
Frequently Asked Questions
What is a good CPC for Google Ads?
There’s no universal “good” number – a good CPC is one that’s below what a converted customer is worth to your business, after accounting for your close rate. A $3 CPC can be bad for a low-margin product and a $12 CPC can be excellent for a high-ticket service.
Why is my CPC higher than the industry average?
The most common causes are a weak Quality Score, broad or loosely matched keywords, low ad relevance, or simply operating in a competitive local market with more advertisers bidding on the same terms than the national average accounts for.
Does CPC include Display and Shopping ads?
Usually not, unless a report specifies otherwise. Most industry benchmarks, including WordStream’s, report Search Network CPC separately from Display, which typically runs far cheaper – often 85% or more below Search.
Is CPC the same as CPA or CPL?
No. CPC is cost per click – what you pay for a single visitor. CPA (cost per acquisition) and CPL (cost per lead) measure cost per completed action, like a purchase or form fill. A low CPC with a poor landing page can still produce a high, unprofitable CPA.
How often do CPC benchmarks change?
Most major trackers, including WordStream/LocaliQ, update their industry benchmark reports annually, though CPC itself shifts continuously within the auction based on seasonality, competitor activity, and algorithm changes.
Sources and methodology
The search-advertising CPC, CTR, conversion-rate, and cost-per-lead figures in this article are treated as benchmark context, not universal targets. The primary source is LocaliQ’s 2026 Search Advertising Benchmarks report, which reports industry-level search advertising results for Google and Microsoft Ads. The report’s average CPC, CTR, conversion rate, and CPL figures should be compared only with campaigns that use similar geography, network, conversion definitions, and industry categories.