Pages per session tells you how many pages the average visitor looked at before they left your site. It sounds simple, and the math is simple, but the metric gets misread constantly. A high number isn’t automatically good. A low number isn’t automatically bad. Context decides that, and most articles skip the context in favor of a dictionary definition.
This guide covers what the metric actually measures, why it disappeared from the default Google Analytics 4 interface, how to calculate and rebuild it yourself, what counts as a reasonable number by site type, and where it quietly misleads people who don’t check their assumptions.
Quick Answer
Pages per session is the average number of pages a visitor views during a single visit to your site. You get it by dividing total pageviews by total sessions over a given time period. In Universal Analytics it was a standard report. In GA4 it isn’t shown by default anymore, but you can still reconstruct it using Views and Sessions, and most teams call the GA4 version “views per session” instead.
A useful range for most content and marketing sites falls somewhere between 1.5 and 3 pages per session, though ecommerce catalogs, SaaS marketing sites, and publishers all sit in different places, which we’ll get into below.
What Pages Per Session Actually Measures
The metric is a ratio, not a behavioral score. It’s telling you, on average, how many page loads happened per visit. That’s it.
Formula:
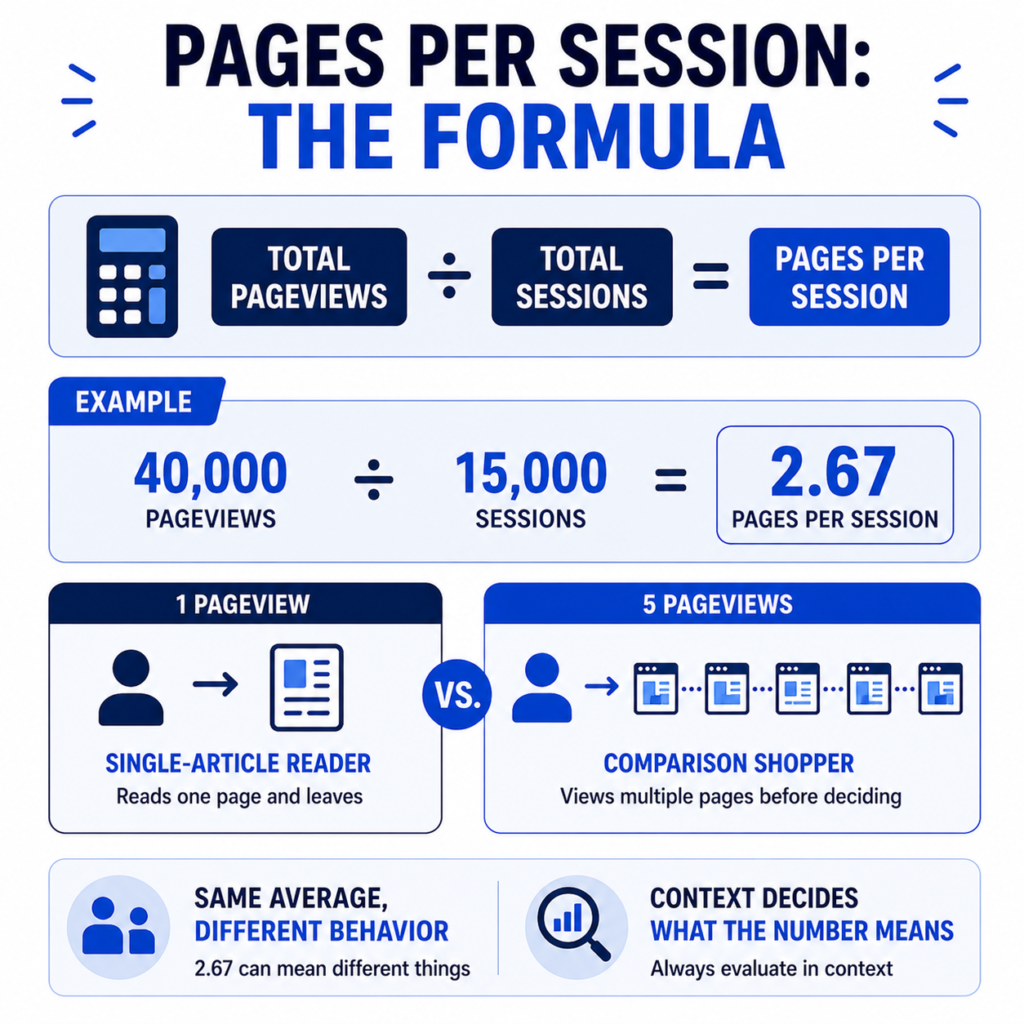
Pages Per Session = Total Pageviews ÷ Total Sessions
If your site had 40,000 pageviews and 15,000 sessions last month, your pages per session is 2.67. Nothing complicated about the arithmetic. The complexity shows up when you try to interpret what 2.67 means for your specific business, because the same number can represent very different visitor experiences depending on the site.
A blog reader who opens one long article, scrolls to the end, and leaves generates 1 pageview in that session. A shopper comparing five product variants generates 5. An average across your whole site blends both patterns together, so the single number hides a lot of what’s actually happening.
Why This Metric Looks Different in GA4
This is where a lot of marketers get tripped up, especially anyone who learned analytics on Universal Analytics and moved to GA4 later.
Universal Analytics was built around sessions as the core unit of measurement. It grouped every user interaction, pageviews, events, transactions, into a session container, and Pages/Session sat right in the Audience Overview report with no configuration required.
GA4 rebuilt the entire measurement model around events instead of sessions. Every pageview is now technically a page_view event, and GA4’s standard reports lean on newer metrics like engaged sessions and engagement rate rather than a straightforward pages-per-session count. GA4 defines an engaged session as one that lasted 10 seconds or longer, included two or more page or screen views, or triggered a conversion event. That’s a genuinely different concept from counting raw pageviews per session, and it’s part of why the two platforms won’t agree with each other even when tracking the same site.
If you’ve migrated from UA to GA4 and your engagement numbers look strange compared to your old reports, you’re not imagining it. Google’s own comparison documentation notes that analysts should expect discrepancies of up to 20% in user and session metrics between Universal Analytics and GA4, largely because of these definitional differences. Pages per session inherits that same gap, since sessions themselves are counted differently between the two systems.
The practical takeaway: don’t try to match your GA4 numbers to your old UA benchmarks exactly. Set new baselines using GA4’s own data and track trends from there.
How to Find or Calculate It in GA4
GA4 doesn’t ship a “Pages Per Session” card in the default reports, but the underlying data is available in a couple of ways.
Option 1: Use the Explore section. Build a free-form exploration with Session as a dimension and Views (or page_view event count) as the metric, then divide totals manually, or drop in a calculated metric that divides Views by Sessions directly.
Option 2: Pull it from Views and Sessions in standard reports. Go to Reports → Engagement → Overview, note your total Views and total Sessions for the period, then divide. It’s the same formula as before, you’re just gathering the two inputs from GA4 instead of reading a pre-built metric.
Option 3: Ask for “Views per session” explicitly. Some teams and some GA4 documentation refer to this reconstructed figure as views per session rather than pages per session, since GA4’s “Views” metric covers both web pageviews and app screen views under one label.
Whichever method you use, be consistent about the date range and any segment filters you apply, since those change both numbers in the ratio and can shift the result more than people expect.
Real-World Example: How the Number Plays Out Differently
Take three businesses with the same monthly session count and look at how differently the metric reads.
A SaaS company with 20,000 sessions and 34,000 pageviews gets 1.7 pages per session. Their homepage, pricing page, and one case study cover most of the buying journey, so visitors don’t need to click around much. That’s a healthy number for their funnel, even though it looks low next to a content site.
An ecommerce store with 20,000 sessions and 76,000 pageviews gets 3.8 pages per session. Shoppers move through category pages, compare two or three product listings, check the shipping policy, and sometimes bounce back to search results before adding to cart. More pages per session here usually correlates with more product discovery, which is generally good, provided it’s leading to checkout and not just aimless browsing.
A local service business with 20,000 sessions and 26,000 pageviews gets 1.3 pages per session. Visitors land on a service page, check the phone number or contact form, and leave. There’s no deep catalog to explore. A low number is expected and not a problem to fix.
None of these businesses should be chasing the same target. If the ecommerce store suddenly matched the local business at 1.3 pages per session, that would likely signal a real drop in product discovery, not efficiency.
What’s a “Good” Pages Per Session Number
There’s no universal benchmark that applies cleanly to every site, but here’s a rough reference range based on common site types:
| Site Type | Typical Pages Per Session |
| Local service business landing pages | 1.2 – 1.8 |
| SaaS marketing site | 1.5 – 2.5 |
| Blog / content publisher | 1.3 – 2.2 |
| Ecommerce store | 2.5 – 5.0 |
| Marketplace or directory site | 3.0 – 6.0 |
These ranges are a starting point, not a scoreboard. If you want to see how your broader engagement metrics compare across industries, our guide on marketing benchmarks by industry lays out comparable ranges for related metrics, and the average session duration article is worth reading alongside this one, since duration and pages per session usually move together and tell a fuller story when read as a pair.
Common Mistakes When Interpreting This Metric
Treating more pages as automatically better. A high pages-per-session count sometimes means visitors are engaged. It sometimes means your navigation is confusing and people can’t find what they came for on the first click. The number alone doesn’t tell you which one you’re looking at.
Comparing it across unrelated site types. Comparing a SaaS pricing page to an ecommerce catalog on this metric is comparing two different jobs. One is built for a quick decision, the other for browsing.
Ignoring single-page sessions in the average. If a large share of your traffic bounces after one page, your average pages per session can look “fine” while masking a real problem in a specific segment, like a paid campaign landing page. Break the number down by channel or landing page before drawing conclusions. This is closely related to bounce rate, and if that number is climbing alongside a falling pages-per-session figure, it’s worth reading why your bounce rate might be so high for troubleshooting steps.
Not segmenting by device. Mobile visitors typically generate fewer pageviews per session than desktop visitors, partly because of smaller screens and partly because mobile sessions skew toward quick, specific intents. Blending both into one number can hide a mobile experience problem.
Forgetting that scroll-heavy single-page content won’t show up here. A 3,000-word article read start to finish is one pageview. GA4’s engagement time and scroll-depth events capture that kind of engagement far better than pages per session ever will.
Pages Per Session vs. Other Engagement Metrics
It helps to see this metric next to the ones people often confuse it with.
| Metric | What It Measures | Where It Falls Short |
| Pages Per Session | Average pageviews per visit | Doesn’t capture time spent or scroll depth |
| Bounce Rate | Share of single-page, non-engaged sessions | Doesn’t tell you what happened after page one for the rest |
| Average Session Duration | Time spent per visit | Can be inflated by idle browser tabs |
| Engagement Rate (GA4) | Share of sessions meeting GA4’s engagement threshold | Threshold-based, so it’s a yes/no signal rather than a scale |
None of these metrics is complete on its own. A visitor could spend four minutes on one long-form page (great duration, one pageview, still counts as engaged in GA4) or click through eight pages in ninety seconds without reading any of them closely. Reading pages per session next to session duration and bounce rate gives you a much clearer picture than any single number in isolation. If you’re building a habit of reviewing these together, our Marketing KPI Dashboard is built for exactly that kind of side-by-side tracking, and the Marketing KPI Formula Library has the underlying formulas for each one if you want to double-check your math.
How to Improve Pages Per Session (When It Actually Needs Improving)
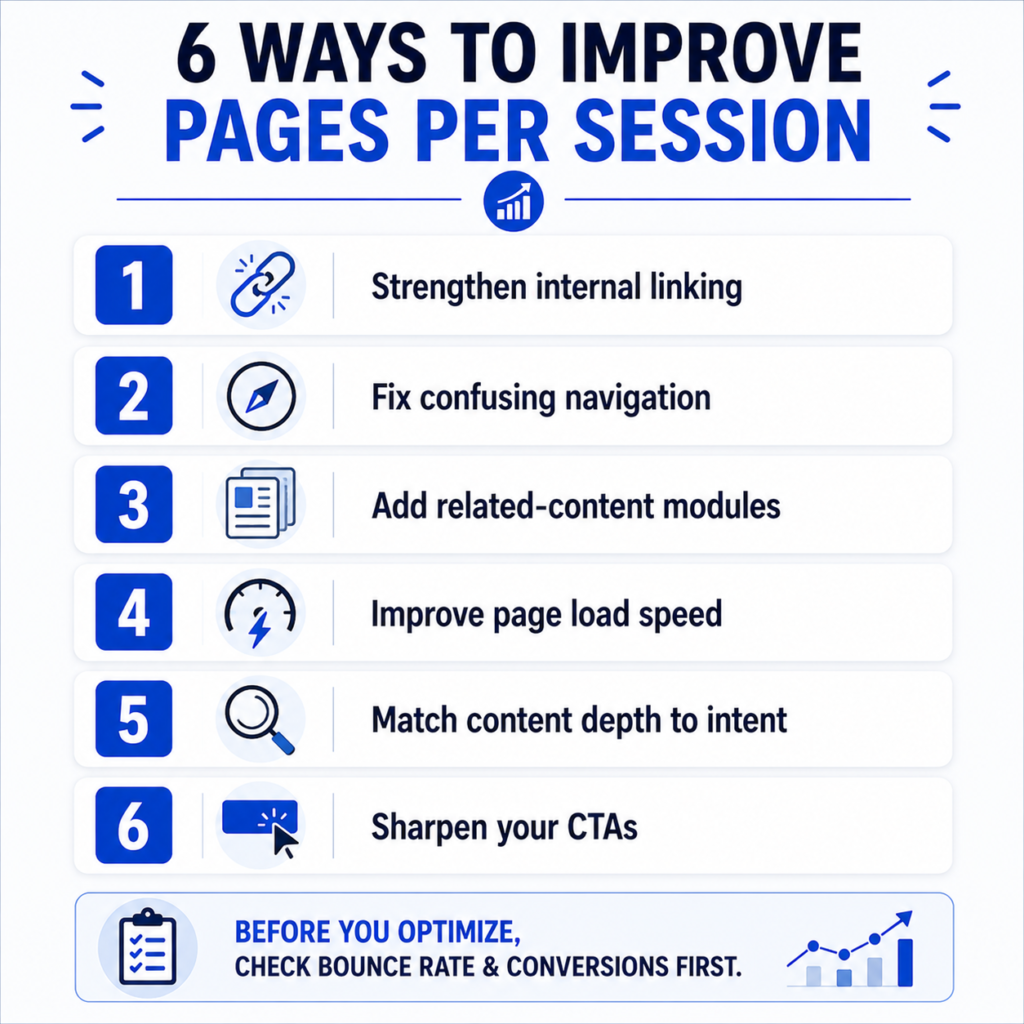
Before optimizing this number, confirm it’s actually a problem for your goals. If your conversion rate and revenue are healthy, a “low” pages per session might just mean your site is efficient. If you’ve confirmed it’s worth improving, here’s where to start.
- Strengthen internal linking. Add contextual links inside your content pointing to related articles, product pages, or tools. Readers who finish one piece and see a relevant next step are far more likely to click through than readers left with a dead end. If you run a smaller site and haven’t formalized this yet, our piece on internal linking for small websites covers a practical starting framework.
- Fix confusing or missing navigation. If visitors can’t find related content because your menu buries it three clicks deep, they’ll leave instead of digging. Audit your top landing pages and check what’s actually reachable from them.
- Add related-content modules. A simple “you might also like” block at the end of an article, driven by category or tag matching, captures visitors who are engaged but weren’t planning to browse further on their own.
- Improve page load speed on high-traffic pages. Slow pages kill follow-up clicks before they happen. A visitor who waits three seconds for your homepage to load is less patient about waiting for the next page too.
- Match content depth to search intent. If someone lands on an informational article looking for a quick answer, forcing them through five pages to get it will frustrate rather than engage them. Sometimes the right fix is giving people what they need faster, not making them click more.
- Review your CTAs. A clear, relevant call to action at the end of a page (a related guide, a tool, a next logical step) does more for this metric than generic “read more” links scattered everywhere.
Where This Metric Falls Short
Pages per session has real limitations worth naming directly, since most articles gloss over this part.
It says nothing about content quality. A visitor clicking through five thin pages looking for an answer they never find will inflate this number while having a genuinely bad experience.
It doesn’t account for single-page apps or sites using heavy client-side routing, where a “page” in the traditional sense might not fire a new pageview event the way GA4 expects, unless you’ve configured virtual pageview tracking correctly.
It treats every page as equal weight. A visitor who reloads your homepage twice by accident counts the same as a visitor who read three distinct, valuable articles.
And it’s a lagging average. By the time this month’s number tells you something changed, you’ve already lost a month of whatever behavior shifted. Pair it with more real-time signals, like scroll depth or exit-page reports, if you want to catch problems earlier.
Frequently Asked Questions
Is pages per session still available in GA4?
Not as a default, pre-built metric in the standard reports. You can reconstruct it using the Explore section by dividing total Views by total Sessions, and many teams refer to this reconstructed figure as “views per session.”
What’s a good pages per session for a small business website?
Most local and small business sites land between 1.2 and 2 pages per session, since visitors typically come with a specific question (services, pricing, contact info) and leave once they find it. That range is normal, not a red flag.
Why did my pages per session drop after switching from Universal Analytics to GA4?
The two platforms count sessions differently, so a direct number-to-number comparison across the migration usually won’t match, even with identical traffic. Treat GA4 as a fresh baseline rather than trying to reconcile it against your old UA reports.
Does a higher pages per session always mean better SEO or engagement?
No. It can reflect genuine content discovery, or it can reflect visitors struggling to find what they need through poor navigation. Check it alongside bounce rate, session duration, and conversion rate before deciding it’s a good or bad sign.
How is pages per session different from bounce rate?
Bounce rate tells you what share of sessions had no meaningful engagement beyond the first page. Pages per session tells you the average pageview count across all sessions, engaged or not. A site can have a low bounce rate and a low pages-per-session number at the same time, if most visitors are engaging deeply with just one page.